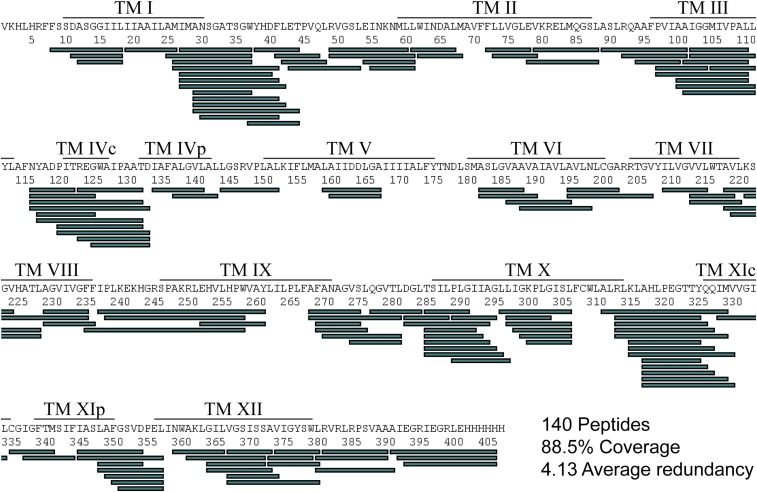
Fig. S1.
Sequence coverage of NhaA. The peptides of NhaA obtained via peptic digestion and LC-IMS/MS analysis are shown as green bars along the sequence. TMs are indicated by black lines above the respective sequence. Only peptides identified with high confidence (score < 6) in four independent experiments per condition were retained for further analysis.

