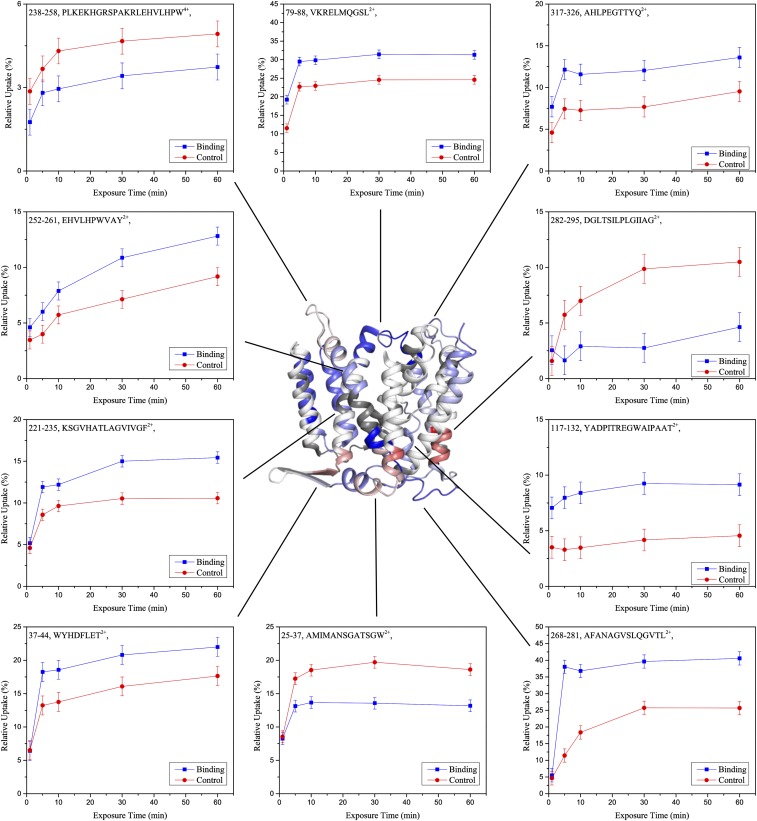
Fig. S2.
Uptake curves of selected peptides. Exemplary uptake curves of peptides displaying significantly altered deuterium uptake in the presence of Li+ and their location on the NhaA crystal structure are shown. The observed relative deuterium uptake for each peptide, time point, and condition were calculated and plotted against the labeling time. Error bars represent the average SD observed across time points and replicates. The difference between these curves were accessed by a two-stage t test (P < 0.05, P < 0.01). Peptides which passed this test were accounted to show significantly altered deuterium uptake in the presence of Li+. Color code as in Fig. 2.

