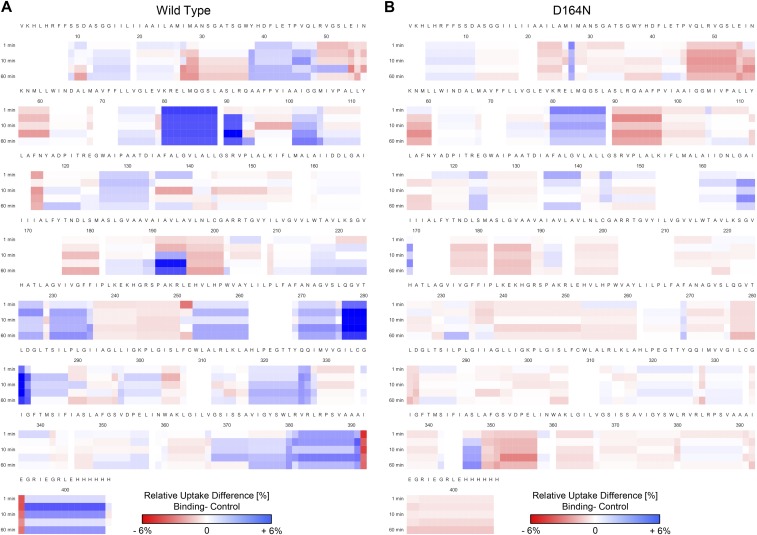
Fig. S3.
Heat maps of differential deuterium uptake for WT NhaA and variant D164N. The differential deuterium uptake, observed in the presence of Li+, is shown as heat map representation for the WT (A) and variant D164N (B). No back-exchange correction and statistical filtering were performed for the heat map generation. For the filtered results, refer to Fig. 2 and Dataset S1.

