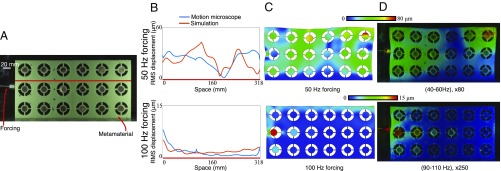
Fig. 4.
The motion microscope is used to investigate properties of a designed metamaterial. (A) The metamaterial is forced at 50 Hz and 100 Hz in two experiments, and a frame from the 50-Hz video is shown. (B) One-dimensional slices of the displacement amplitude along the red line in A are shown for both a finite element analysis simulation and the motion microscope. (C) A finite element analysis simulation of the displacement of the metamaterial. Color corresponds to displacement amplitude, and the material is warped according to magnified simulated displacement vectors. (D) Results from the motion microscope are shown. Displacement magnitudes are shown in color at every point on the metamaterial, overlayed on frames from the motion-magnified videos (Movies S4 and S5).

