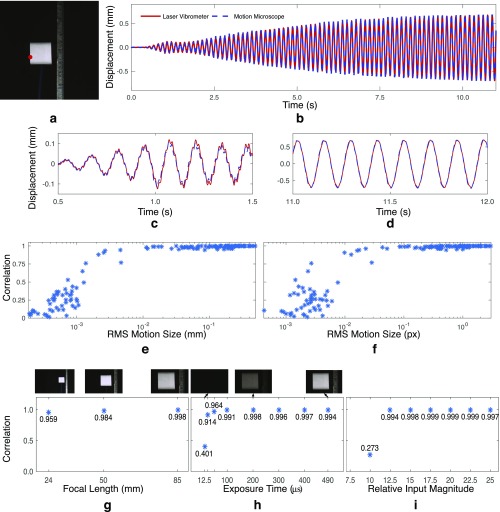
Fig. S4.
A comparison of our quantitative motion estimation vs. a laser vibrometer. Several videos of a cantilevered beam excited by a shaker were taken, with varying focal length, exposure times, and excitation magnitude. (A) A frame from one video. (B) Motions from the motion microscope at the red point are compared with the integrated velocities from a laser vibrometer. (C) B from 0.5 s to 1.5 s. (D) B from 11 s to 12 s. (E) The correlation between the two signals across the videos vs. the RMS motion size in pixels, measured by the laser vibrometer. (F) The correlation between the two signals across the videos vs. the RMS motion size in pixels measured by the laser vibrometer. (G) The correlation between the signals vs. focal length (exposure time, s; excitation magnitude, 15). (H) Correlation vs. exposure time (focal length, mm; excitation magnitude, 15). Cropped frames from the corresponding videos are shown above. (I) Correlation vs. relative excitation magnitude (focal length, mm; exposure time, s). Only motions at the red point in A were used in our analysis.

