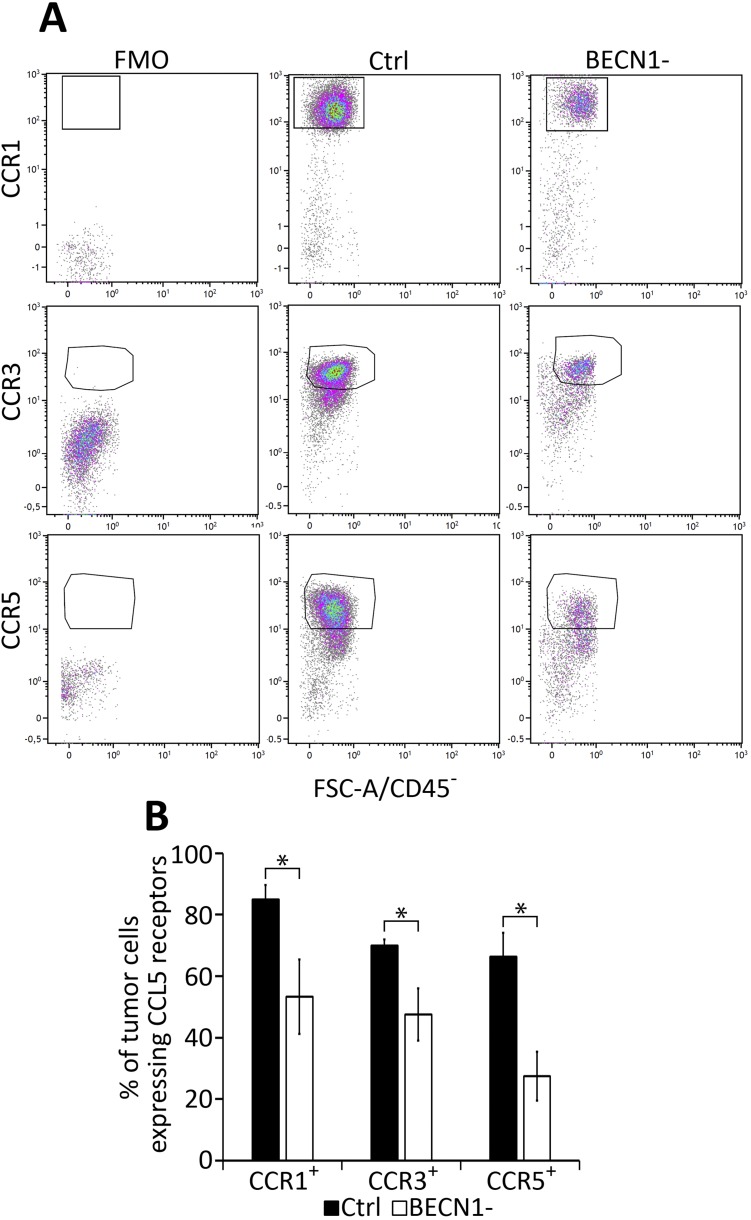
Fig. S6.
Percentage of CCL5 receptors expressed in Ctrl and BECN1− B16-F10 tumors. Tumor cells from Ctrl and BECN1− B16-F10 tumors were stained with CCR1-, CCR3-, and CCR5-specific antibodies and were subjected to flow cytometric analyses. CD45− cells were gated and defined as tumor cells after which the percentage of CCR1+, CCR3+, and CCR5+ tumor cells were determined. (A) Representative flow cytometry plots of CD45−CCR1+; CD45−CCR3+, and CD45−CCR5+ in Ctrl and BECN1− B16-F10 tumors. Quadrant settings were based on the cells stained with FMO and then applied to the plots of cells stained with positive antibodies. (B) Percentage of CCR1, CCR3, and CCR5 in total CD45− cells from Ctrl and BECN1− B16-F10 tumors. Data shows the significant differences in the percentage of CCR1, CCR3, and CCR5 between tumor cells from Ctrl and BECN1− tumors. Results are the average ± SEM of four mice from each group. *P < 0.05 (two-tailed Student’s t test).

