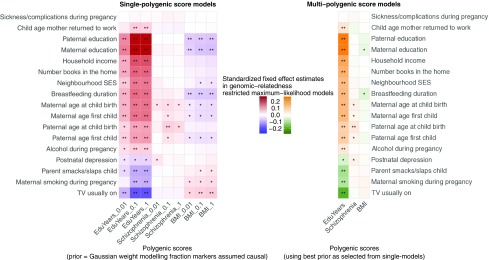
Fig. 1.
(Left) Single-polygenic score models: associations between polygenic scores and environmental exposures and single-predictor effects of polygenic scores for years of education, BMI, and schizophrenia on the environmental exposures. (Right) Multipolygenic score models: joint estimation of effects of polygenic scores on environmental exposures and effects of polygenic scores for years of education, BMI, and schizophrenia on the environmental exposures while adjusting for other predictors, respectively. Color gradients represent effect sizes as standardized coefficients—that is, SDs change in the environmental exposure, per SD increase in the polygenic predictor (see SI Appendix, Tables S1–S3 for full statistics). *Uncorrected P < 0.05, **multiple testing corrected P < 0.05 (see Materials and Methods).

