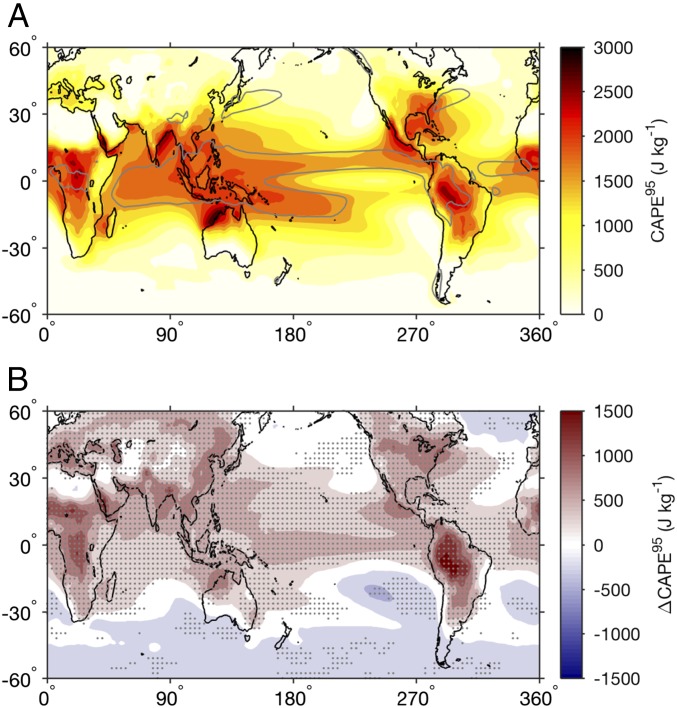
Fig. 1.
(A) Ensemble mean of CAPE95 (colors) and 5 mm contour of time mean and ensemble mean precipitation (gray) based on 12 CMIP5 models for the period 1981–2000. (B) Change in the ensemble mean CAPE95 from the current climate (1981–2000) to the future climate (2081–2100) under the RCP8.5 scenario. Stipling in B indicates regions where 11 of the 12 models agree on the sign of the response.

