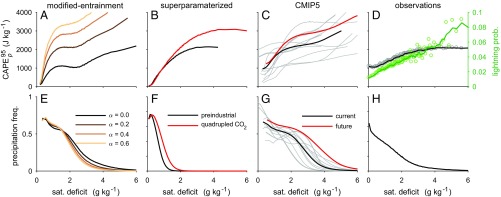
Fig. 3.
(A–D) The 95th percentile of CAPE in strongly precipitating regions (; left axis) and (E–H) frequency (freq.) of daily precipitation exceeding 5 mm, as a function of the lower-tropospheric saturation (sat.) deficit for (A and E) modified entrainment simulations for different values of the entrainment parameter , (B and F) superparameterized GCM simulations of preindustrial climate (black) and quadrupled CO2 concentration (red), (C and G) CMIP5 ensemble mean in the current climate (1981–2000; thick black; individual models shown in gray) and in the future climate under the RCP8.5 scenario (2081–2100; thick red), and (D and H) observations. Statistics are calculated using 100 bins, each containing roughly the same proportion of the available data. In D, lightning frequency in strongly precipitating regions is plotted as a function of lower-tropospheric saturation deficit (green, right axis), and lines are smoothed with a five-point Lowess filter, with symbols giving unsmoothed values.

