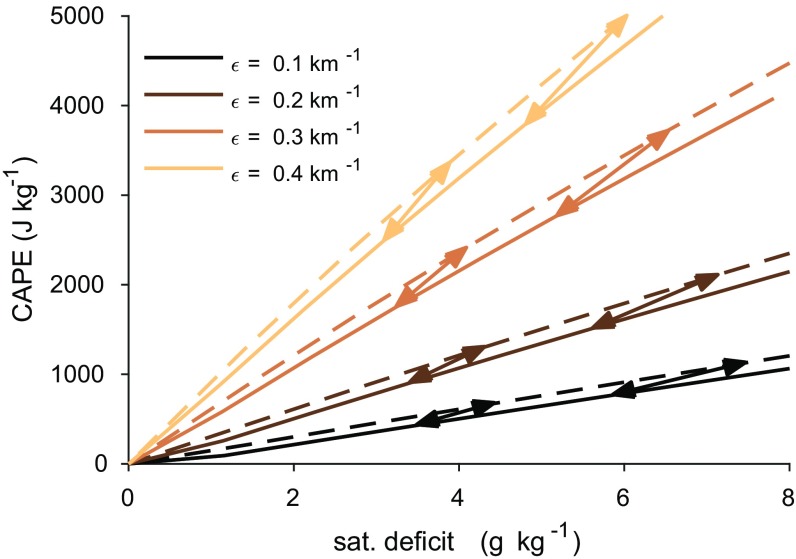
Fig. 4.
CAPE as a function of lower-tropospheric saturation deficit calculated using the zero-buoyancy plume model. Calculations are performed with a surface relative humidity of 80% and surface temperatures of 300 K (solid) and 303 K (dashed) for values of the environmental relative humidity in the free troposphere varying between 20% and 100% and entrainment rates as given in the legend. Arrows connect solutions with the same relative humidity for different surface temperatures.

