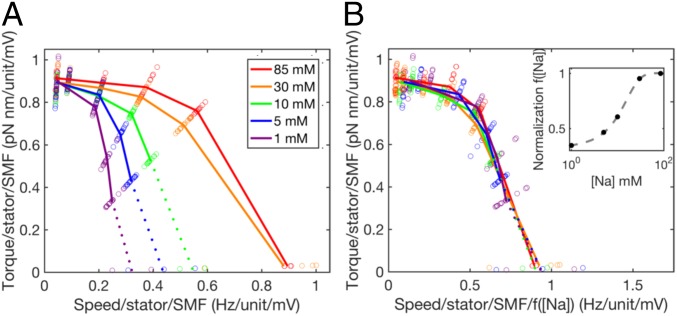
Fig. 3.
Normalized torque–speed curves of the Na+-driven motor. (A) Seventy-five individual torque–speed curves similar to those of Fig. 2 but including data obtained at pH 5, 5.5, 6, 6.5, and 7 and with both torque and speed normalized by the number of stator units and the SMF, the latter estimated from pH and [Na+] as described (25). Colored lines (corresponding to Fig. 2) show averages for each [Na+] over stator number and pH. This plot combines data from this study and two previous studies (13, 25), showing average measurements from 396 combinations of bead size, [Na+], pH, and stator unit number. (B) The same as A but with speeds further divided by an empirical normalizing function [Na+] (Inset; fit by a logistic function; dashed line) that collapses all 75 torque–speed curves onto a single curve. Dotted lines assign gold bead stator number under the assumption that some speed levels are not resolved for 1, 5, and 10 mM [Na+].

