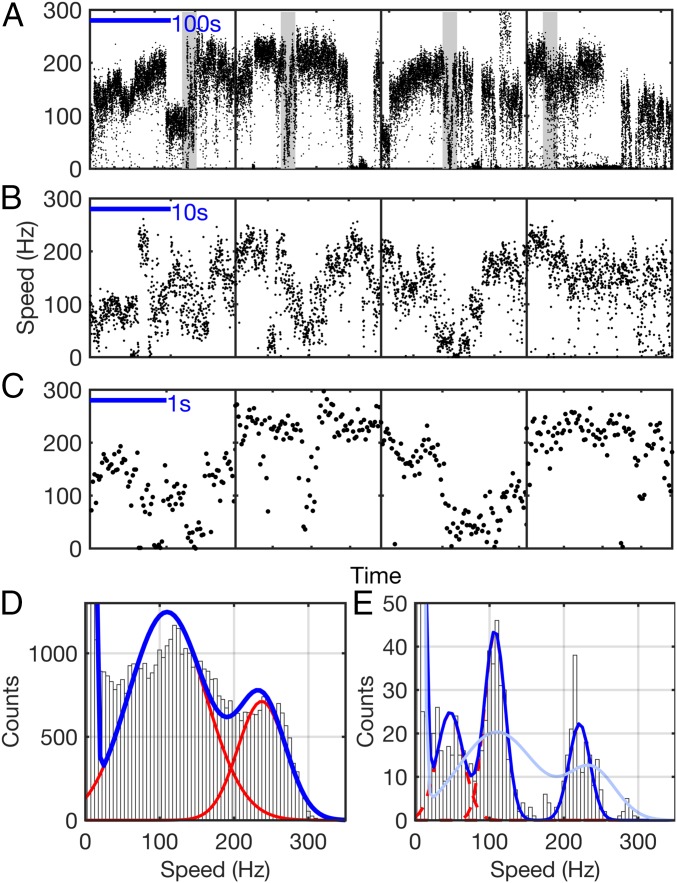
Fig. 4.
Discrete speed levels of the H+-driven motor at low load. (A–C) Typical speed time traces for 100-nm gold beads attached to the hook of single H+-driven (WT) flagellar motors. As with Na+ motors in Fig. 1 B–D, transitions between distinct speed levels are seen on timescales ranging from seconds to minutes. Data shown in A were acquired at 20 kHz, and shaded portions in A are shown in B. Separate traces, shown in C, were acquired at 109.5 kHz. (D) Histogram of speeds of 100-nm gold beads attached to H+-driven motors from records, such as those illustrated in A–C [8 cells (1,394 s) acquired at 20 kHz on the QPD and 51 cells (53 s) acquired at 109.5 kHz on a high-speed camera]. Distinct speed levels are seen as peaks in the histogram, and fit (blue line) is seen as a sum of Gaussians (red lines). (E) Histogram of the subset (96%, eight cells) of data in D that was acquired in continuous blocks longer than 9 s, down-sampled, and filtered to match the time resolution of previous low load data (14) (SI Results). The distribution was fit (blue line) as a sum of Gaussians (red lines). The scaled distribution of D is overlaid (light blue).

