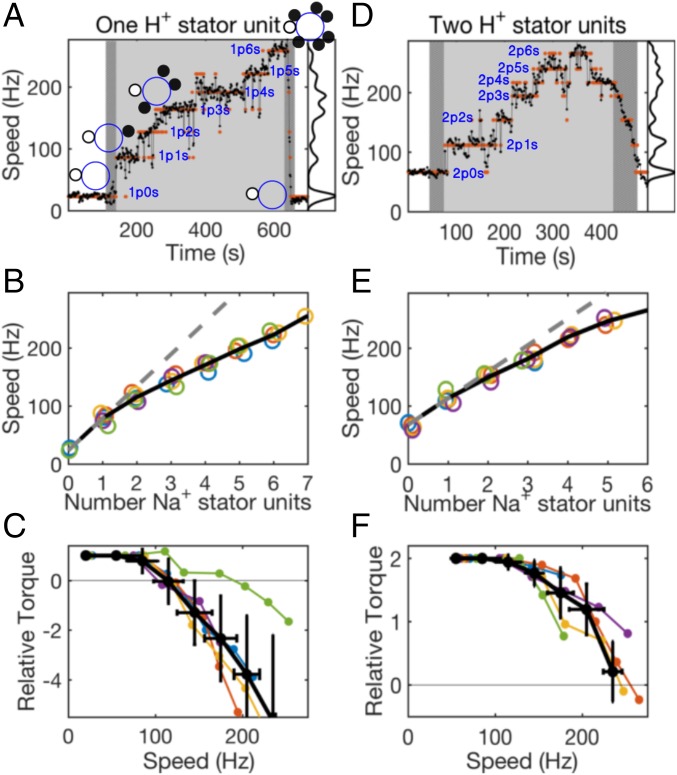
Fig. 5.
Torque–speed curves for one and two H+ stator units measured in hybrid fuel motors. (A and D) Typical speed verus time traces of motors containing (A) one and (D) two H+ stator units, with a speed histogram on the right. Orange dots show the speed level of each data point assigned by k-means clustering. Light shading and dark shading indicate 85 mM [Na+] and transitions between 0 and 85 mM [Na+], respectively. Na+ stator units are recruited in 85 mM [Na+]: interpretations of the number and type of units engaged in the motor are shown, where ps indicates H+ units and Na+ units. (B and E) Speed versus the number of Na+ units for all motors that showed the same speed before and after addition of 85 mM [Na+] (five motors each). Each motor in each plot is shown in a different color; the motors from A and D are shown in orange. The black solid lines connect the mean speed of all of the motors for each number, and the black dashed lines are linear fits to the points of the first (B) three or (E) two units (those for which motor speed is less than 115 Hz, the approximate position of the knee of the torque–speed curve). (C and F) Calculated torque–speed curves for one and two H+ stator units. Colors match those in B and E. The black lines show average torque–speed curves (mean SD), with each point an average over speed bins of width 40 Hz.

