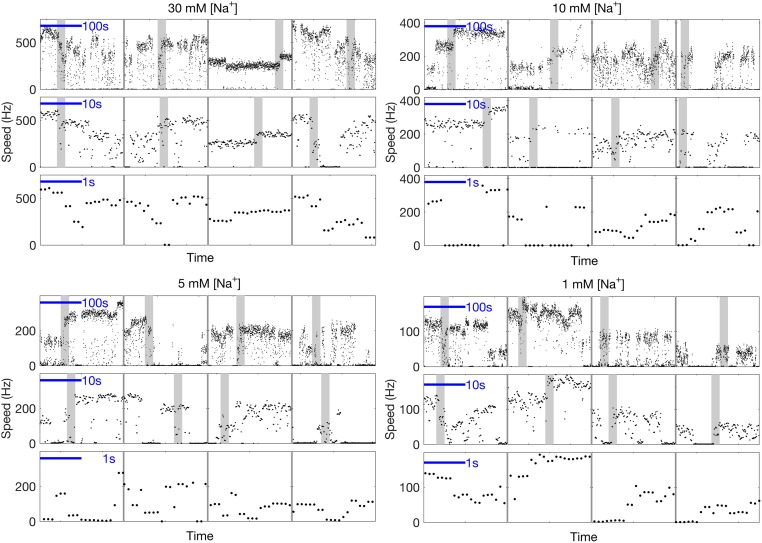
Fig. S1.
Four panels showing typical speed time traces for a 100-nm gold bead attached to the hook of single Na+-driven BFM at pH 7.0, where [Na+] is labeled at the top of each panel. Transitions between a characteristic set of distinct speed levels are seen on timescales ranging from seconds to minutes. Shaded portions in the top and middle rows of each panel are represented in the middle and bottom rows, respectively, of each panel.

