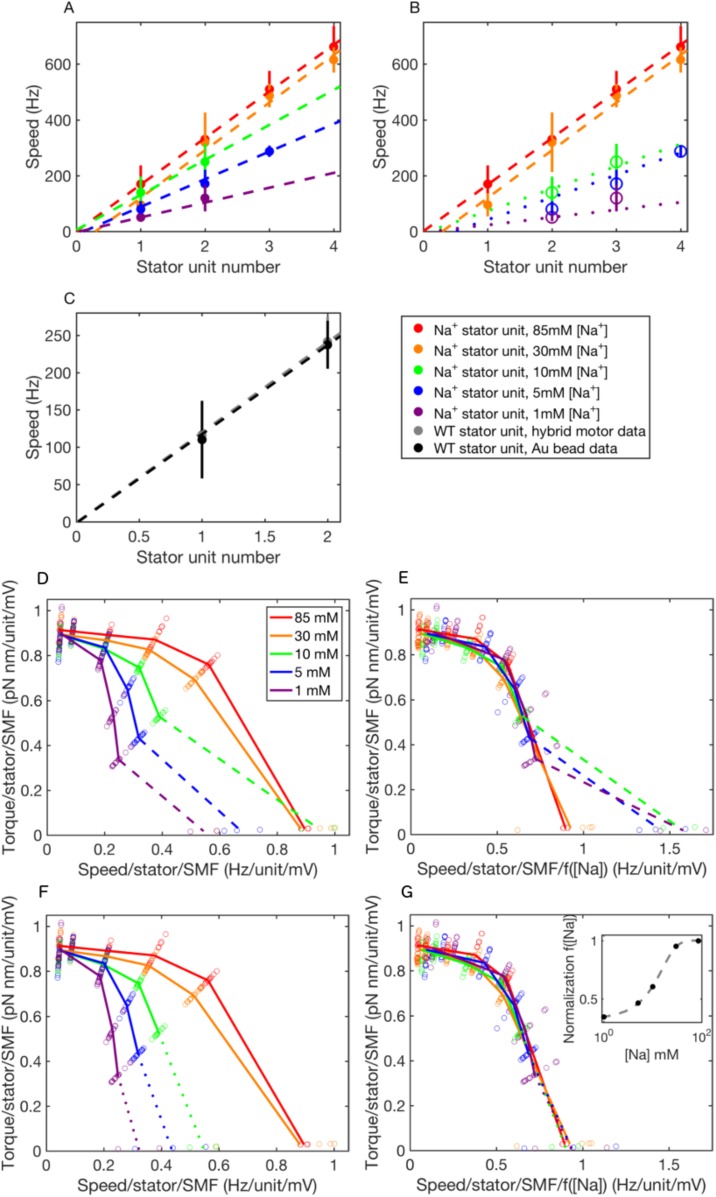
Fig. S2.
Speed versus stator number and torque–speed curves. (A–C) Approximate linearity of BFM speed with stator unit number. Data points and error bars give averages and SDs, respectively, from the experiments listed. (A and B) Na+ stator units: filled symbols show assignments of stator unit number based on the assumption that the lowest resolved speed corresponds to a single stator unit (fit with dashed lines). Open symbols in B show alternative assignments of stator unit number at low [Na+] (fit with dotted lines) based on the assumption that speed levels for a single stator unit are not always resolved in the multiple Gaussian fits of Fig. 2A. (C) H+ stator units. Linear regression fits are weighted by the inverse of the variance in speed. (D–G) Normalized torque–speed curves of the Na+-driven motor. (D and F) Seventy-five individual torque–speed curves as shown in Fig. 2. Colored lines show averages for each [Na+] over numbers of stators and pH values. This plot combines data from this study and two previous studies (13, 25), showing average measurements from 396 combinations of bead size, [Na+], pH, and stator unit number. (E and G) The same as D and F but with speeds further divided by an empirical normalizing function [Na+] (G, Inset; fit by a logistic function; dashed) that collapses all 75 torque–speed curves onto a single curve. Dashed lines (D–E) assign gold bead stator number under the assumption that the lowest speed corresponds to a single stator, as in A. Dotted lines (F and G) assign gold bead stator number under the assumption that some speed levels are not resolved, as in B. Plots (F and G) are reproduced from Fig. 3.

