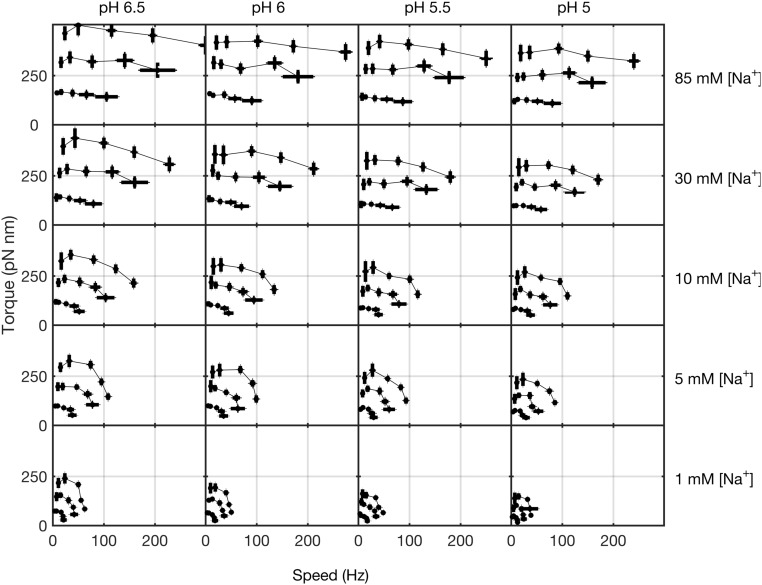
Fig. S3.
Torque–speed curves of the Na+-driven motor calculated from previously published data showing one to three stator units obtained with polystyrene beads of diameters 0.2–1.0 m at a range of pH values (shown along the top and corresponding to columns) and [Na+] concentrations (shown at the right and corresponding to rows) (13, 25). All show the previously reported concave-down shape of a single stator (13).

