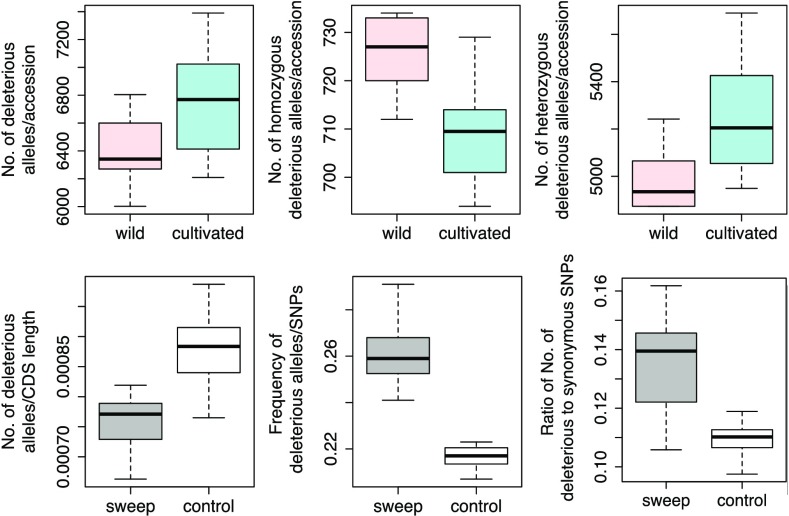
Fig. 4.
The number and frequency of derived deleterious alleles in cultivars and wild samples. (Top) Comparisons between vinifera and sylvestris for the number of deleterious variants per individual overall (Left), as homozygotes (Middle), and as heterozygotes (Right). (Bottom) Comparisons between sweep regions and the rest of the genome (control) for the number (Left), population frequency (Middle), and ratio (Right) of the number deleterious to synonymous variants per vinifera individual.

