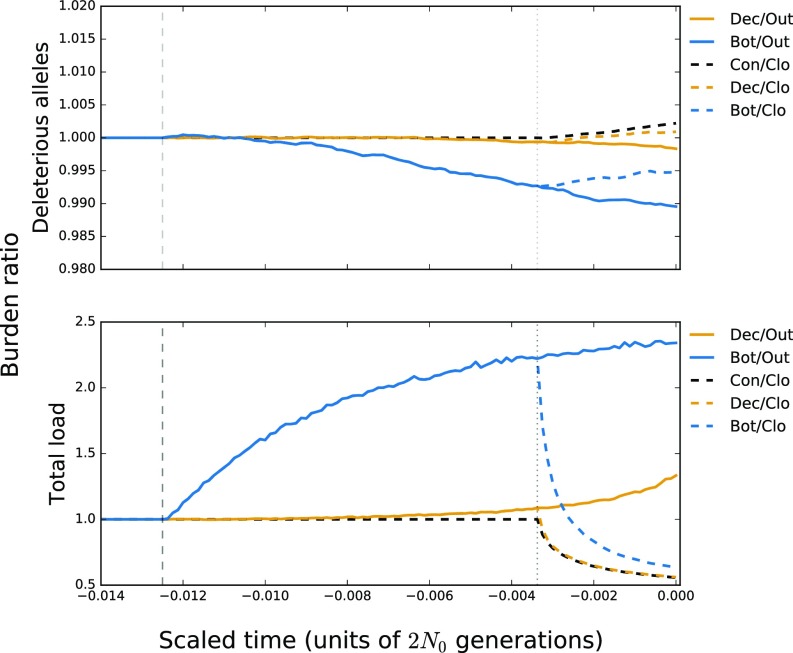
Fig. 5.
Forward simulations under a model of recessive selection for three demographic scenarios and two mating systems. (Top) The average number of deleterious alleles per accession relative to an outcrossing population of constant size. (Bottom) The total load relative to an outcrossing population of constant size. The dashed lines represent the time of demographic shift, ∼30 kya, and the onset of clonal propagation during domestication ∼8 kya. Bot, bottleneck; Clo, clonal propagation; Con, constant population size; Dec, declining population size; Out, outcrossing.

