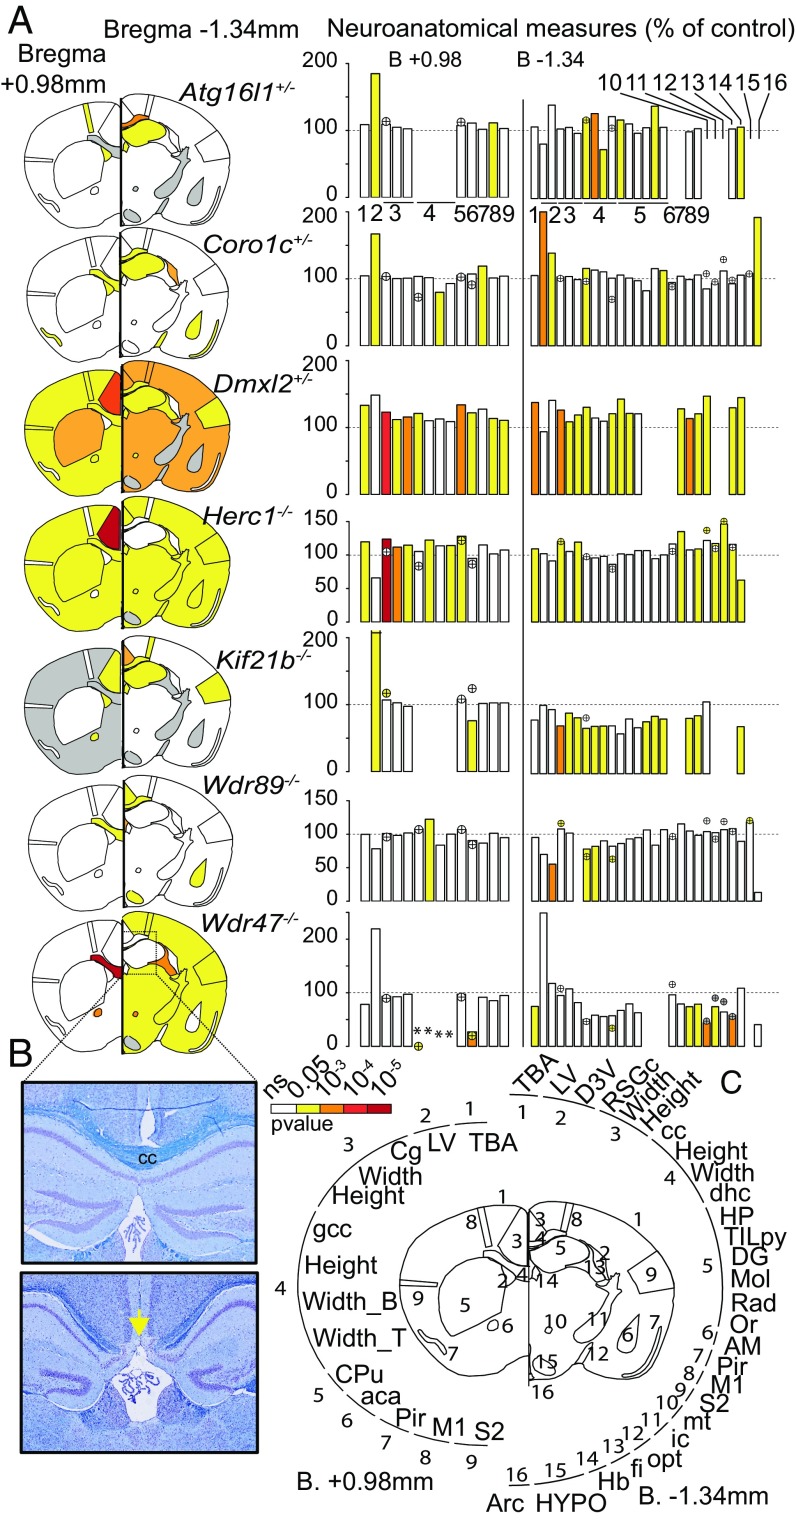
Fig. 1.
Relevance of mouse WDR genes in adult brain morphogenesis. (A) Brain features plotted in two coronal planes according to P values for seven WDR genes (n = 3 per group). White indicates P > 0.05, and gray indicates no data. Histograms of percentage changes relative to WT animals (100%) are colored according to the significance level. Circles with crosses indicate cell count measurements. Statistical analyses were carried out using the linear mixed model framework within Phenstat (56). *Agenesis of the assessed region. (B) Brain images at Bregma −1.34 mm stained with cresyl violet and luxol blue showing the corpus callosum (cc) in WT (Upper) and agenesis of the cc in Wdr47−/− (Lower). The yellow arrow shows the agenesis (absence) of the corpus callosum. (Magnification: 20×.) (C) Numbers around the circle show assessed brain regions (a description is provided in Dataset S2). aca, anterior part of anterior commissure; AM, amygdala; Arc, arcuate nucleus; B, bottom; Cg, cingulate cortex; CPu, caudate putamen; D3V, dorsal third ventricle; DG, dentate gyrus; dhc, dorsal hippocampal commissure; fi, fimbria; gcc, genu of cc; Hb, habenula; HP, hippocampus; HYPO, hypothalamus; ic, internal capsule; LV, lateral ventricles; M1, motor cortex; Mol, molecular layer of HP; mt, mammillothalamic tract; ns, not significant; opt, optical nerve; Or, oriens layer of HP; Pir, piriform cortex; Rad, radiatum layer of HP; RSGc, retrosplenial granular cortex; S2, somatosensory cortex; T, top; TBA, total brain area; TILpy, total pyramidal cell layer.

