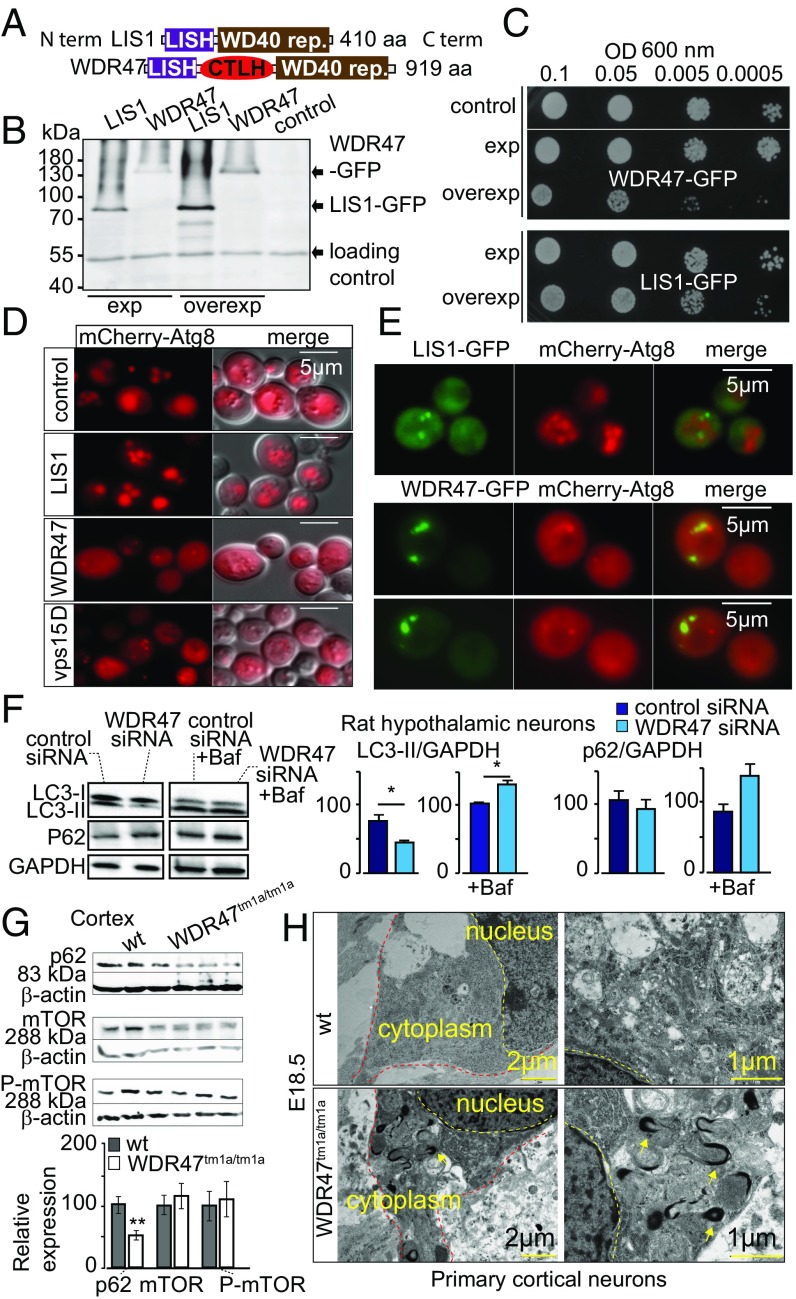
Fig. 7.
WDR47 is a key effector of autophagy. (A) WDR47 and LIS1 structures. (B) Western blot on yeast protein extracts with anti-GFP antibodies. (C) Drop test growth assays done on WT yeast cells (BY4742) transformed with pAG413 [low-copy number centromere (CEN) plasmid; expression] or pAG423 (2 microns; overexpression) plasmids bearing LIS1 or WDR47. Midlog phase cultures of the indicated yeast cells serially diluted to the indicated OD600 and spotted onto synthetic medium without histidine (SC-His). Growth evaluated after 2 d of incubation at 30 °C. (D) WT BY4742 (control) or vps15Δ (negative control) yeast cells transformed with mCherry-Atg8 plasmid and WT BY4742 cells cotransformed with expression plasmid (pAG413) bearing LIS1 or WDR47 cDNA observed by fluorescent microscopy after incubation for 4 h in nitrogen starvation medium (SD-N) to induce autophagy. (Scale bars: 5 μm.) (E) Living WT yeast cells (BY4742) expressing human LIS1-GFP or WDR47-GFP and mCherry-Atg8 observed by fluorescence microscopy after induction of autophagy by incubation in SD-N medium. (F) Western blot quantification of LC3 and p62 relative protein levels in the presence and absence of Bafilomycin A1 (Baf) treatment in response to WDR47 siRNA treatment. GAPDH was used as a loading control. (G) Western blot images of p62, mTOR, and phospho-mTOR in the cortex of WT and Wdr47tm1a/tm1a. Quantification of relative protein expression normalized against β-actin is plotted as mean ± SEM (n = 6 Wdr47tm1a/tm1a and n = 9 WT, male and female). *P < 0.05; **P < 0.01. (H) Transmission EM of cortical neurons from Wdr47tm1a/tm1a embryos (n = 3) at E18.5 compared with WT (n = 3). (Scale bars: Left, 2 μm; Right, 1 μm.)

