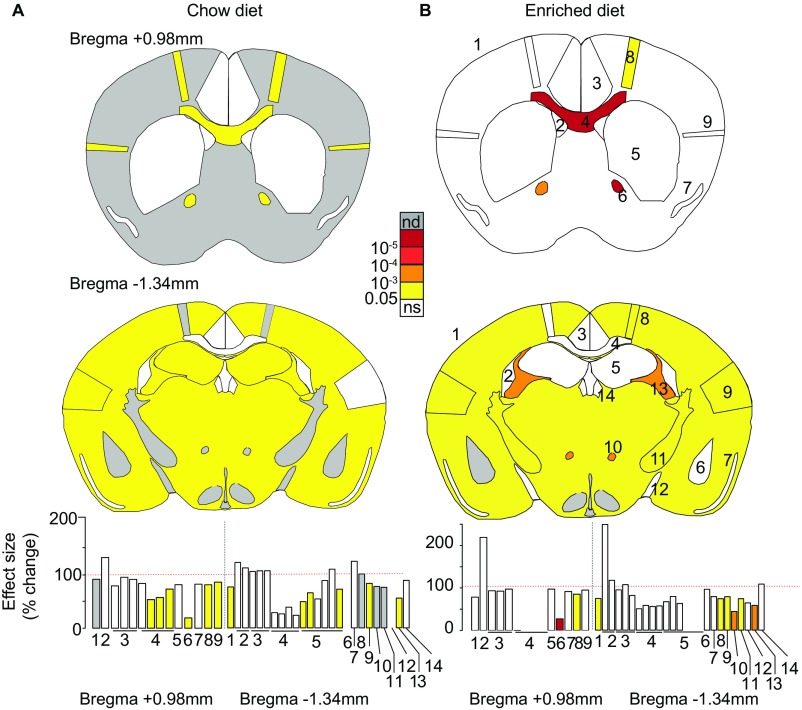
Fig. S4.
Impact of enriched diet on brain anatomy. Schematic representation of brain features plotted in two coronal planes according to P values for chow diet- (A) and enriched diet-fed (B) mice. The first schematic image represents the striatum section (Bregma +0.98 mm), and the second represents the hippocampus section (Bregma −1.34 mm). White indicates P value higher than 0.05, and gray is no data (nd) for absence of data. Histograms of percentage changes relative to WT animals (100%) are colored according to the significance level are shown at the bottom. Section 1–1: 1_TBA; 2: 1_LV; 3: 1_Cg, 1_Cg_Width, 1_Cg_Height; 4: 1_gcc, 1_gcc_Height, 1_gcc_Width_T, 1_gcc_Width_B; 5: 1_CPu; 6: 1_aca; 7: 1_Pir; 8: 1_M1; 9: 1_S2. Section 2–1: 2_TBA; 2: 2_LV, 2_D3V; 3: 2_RSGc, 2_RSGc_Width, 2_RSGc_Height; 4: 2_cc, 2_cc_Width, 2_cc_Height, 2_dhc; 5: 2_HP, 2_TILpy, 2_DG, 2_Mol, 2_Rad, 2_Or; 6: 2_AM; 7: 2_Pir; 8: 2_M1; 9: 2_S2; 10: 2_mt; 11: 2_ic; 12: 2_opt; 13: 2_fi; 14: 2_Hb (a full description is in Dataset S2). ns, not significant.

