Fig. S6.
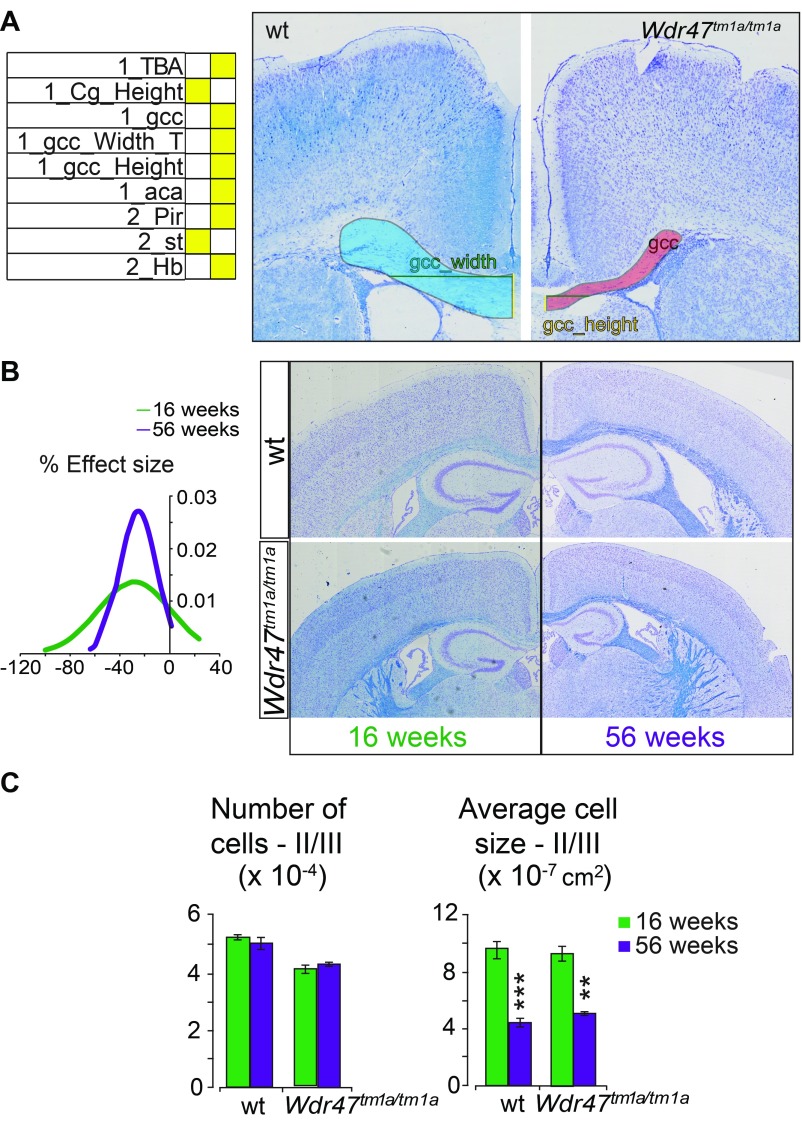
Neuroanatomical characterization of P8 and 16- and 56-wk old mice. (A) Heat map of neuroanatomical defects in Wdr47tm1a KO mice at P8 (n = 2 Wdr47tm1a/tm1a, n = 4 Wdr47+/tm1a, n = 3 WT) (Dataset S9) and representative images illustrating neuroanatomical anomalies, such as reduced primary motor cortex (M1) thickness at Bregma 2.19 mm. (Magnification: 20×.) (B) Plot of a normal distribution (based on density function) representing the effect size of 38 neuroanatomical measurements recorded on coronal plane in mice ages 56 wk old in comparison with mice at 16 wk old (male, n = 3) (Dataset S9). No visual difference is evident in the image montage of WT and Wdr47tm1a/tm1a mice coronal brain sections at 16 and 56 wk of age. (Magnification: 20×.) (C) Number and average size of cells in layers II/III of the cortex in mice ages 16 and 56 wk old (male, n = 3). All plots are represented as mean + SEM. Statistical analysis was done using Student’s t test (two-tailed). **P < 0.01; ***P < 0.001. aca, anterior part of anterior commissure; Cg, cingulate cortex; gcc, genu of the corpus callosum; Hb, habenula; Pir, piriform cortex; T, top; TBA, total brain area.

