Fig. S7.
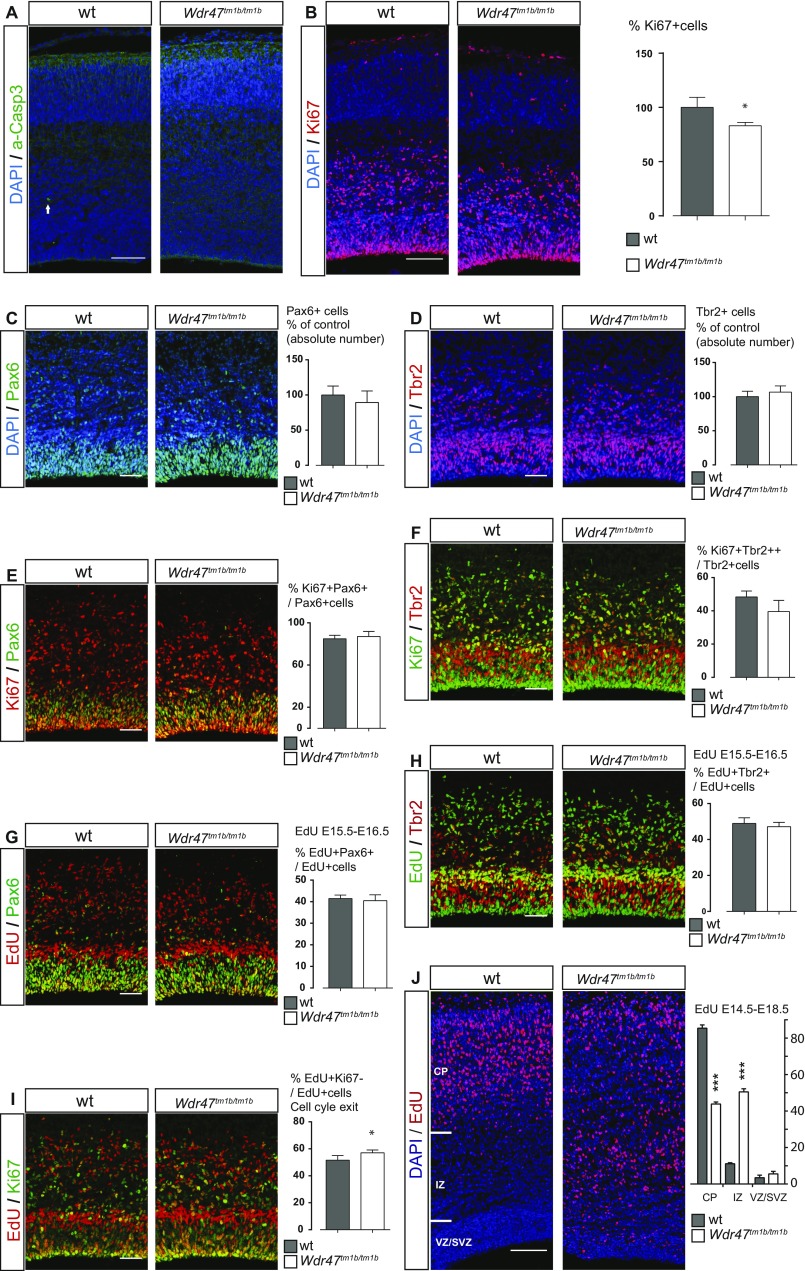
Wdr47 deletion does not affect early stages of cortical development. (A) E16.5 WT and Wdr47tm1b/tm1b cortices showing apoptotic cells (activated Caspase3+ in green). Arrow points to a-Caspase3+ cell. (B) E16.5 WT (n = 3) and Wdr47tm1b/tm1b (n = 4) cortices showing cycling progenitors (Ki67+ in red). *P < 0.05 (Student’s t test, two-tailed). (C and D) E16.5 WT (n = 3) and Wdr47tm1b/tm1b (n = 4) cortices showing apical progenitors (C; Pax6+ in green) and intermediate progenitors (D; Tbr2+ in red). (E and F) E16.5 WT (n = 3) and Wdr47tm1b/tm1b (n = 4) cortices showing cycling apical progenitors (E; Pax6+ in green and Ki67+ in red) and cycling intermediate progenitors (F; Tbr2+ in red and Ki67+ in green). (G and H) E16.5 WT (n = 3) and Wdr47tm1b/tm1b (n = 4) cortices showing newborn apical progenitors (G; Pax6+ in green and newborn cells injected with EdU at E15.5 in red) and newborn intermediate progenitors (H; Tbr2+ in red and newborn cells injected with EdU at E15.5 in green). (I) E16.5 WT (n = 3) and Wdr47tm1b/tm1b (n = 5) cortices showing newborn cells (injected with EdU at E15.5 in red) and cycling progenitors (Ki67+ in green). *P < 0.05 (Student’s t test, two-tailed). (J) E18.5 WT (n = 3) and Wdr47tm1b/tm1b (n = 3) cortices injected with EdU at E14.5 quantified as percentage of EdU+ cells in several brain regions as indicated on the image. All plots are represented as mean + SEM. All representative images were produced using confocal microscopy, and nuclei counterstaining were performed with DAPI (blue). Wdr47tm1b/tm1b expressed as proportion of control (B–D). CP, cortical plate; IZ, intermediate zone; SVZ, subventricular zone; VZ, ventricular zone. (Scale bars: A, B, and J, 100 µm; C–I, 50 µm.) ***P < 0.0001 (two-way ANOVA followed by Bonferroni correction).

