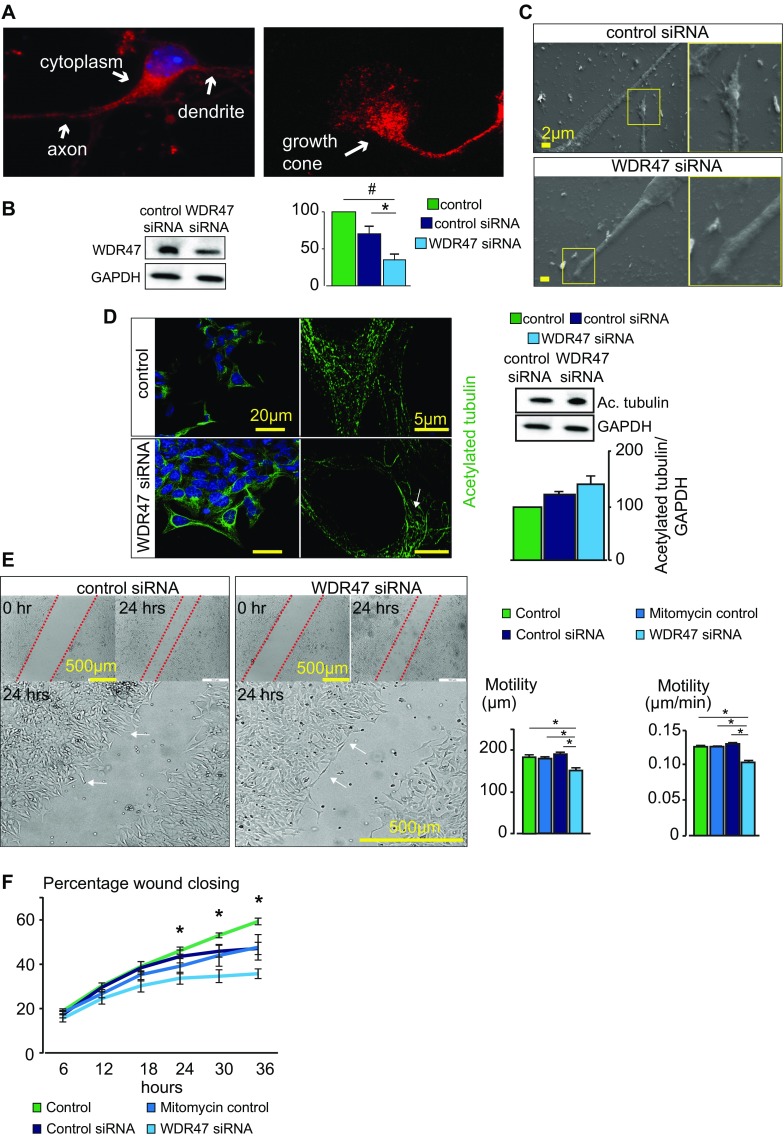
Fig. S8.
WDR47 subcellular localization and neuronal wound assay. (A) Subneuronal localization of WDR47 using immunofluorescence (red) in primary cortical cultures of WT mice. (Magnification: 65×/one oil objective.) (B) Western blot verification of WDR47 knockdown in rat GT1-7 hypothalamus-derived neuronal cells in WDR47 siRNA-treated cells compared with control siRNA cells 24 h posttransfection (n = 7). (C) Scanning electron micrographs of control siRNA and WDR47 siRNA neurons at the level of the axon and growth cone in the migration zone. (Scale bar: 2 μm.) (D) Representative confocal (Left) and SR-SIM (Right) fluorescent micrographs of acetylated tubulin networks in control siRNA (Upper) and WDR47 siRNA-treated cells (Lower). The white arrow shows a highly convoluted structure in the perinuclear region. Western blot analysis of acetylated tubulin is carried out in control siRNA compared with WDR47 siRNA-treated cells. Normalization is done using housekeeping gene GAPDH. (Scale bars: Left, 20 μm; Right, 5 μm.) (E, Left) Transmission light micrographs of an in vitro 36-h neuronal migration assay of rat GT1-7 neuronal cells treated with control or WDR47 siRNA. The dashed red lines show the edge of the wound. White arrows indicate neurons at the edge of the wound. (E, Right) Average migration distance and migration velocity (micrometers per minute) in WDR47 siRNA-treated cells compared with the mitomycin control group or control siRNA group (n = 4 in each group). (F) Percentage of wound closure is shown over time in WDR47 siRNA-treated cells (n = 4). All plots are represented as mean ± SEM. #P < 0.07; *P < 0.05 (Student’s t test, two-tailed).

