NEUROSCIENCE Correction for “Cdk5-dependent phosphorylation of liprinα1 mediates neuronal activity-dependent synapse development,” by Huiqian Huang, Xiaochen Lin, Zhuoyi Liang, Teng Zhao, Shengwang Du, Michael M. T. Loy, Kwok-On Lai, Amy K. Y. Fu, and Nancy Y. Ip, which was first published July 31, 2017; 10.1073/pnas.1708240114 (Proc Natl Acad Sci USA 114:E6992–E7001).
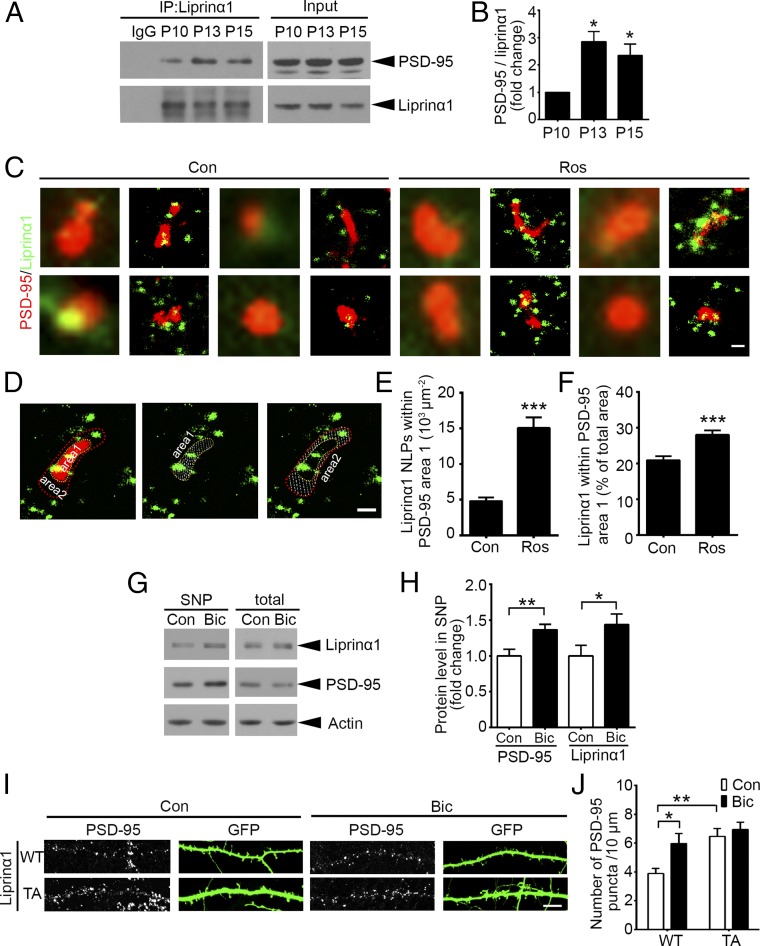
The authors note that Fig. 3 appeared incorrectly. The corrected figure and its legend appear below.
Fig. 3.
Reduction of liprinα1 phosphorylation enhances liprinα1–PSD-95 binding and promotes PSD-95 synaptic localization. (A and B) Coimmunoprecipitation of liprinα1 and PSD-95 in mouse brains at P10–P15. (A) Representative Western blot. (B) Quantification of PSD-95 bound to liprinα1. PSD-95 normalized to immunoprecipitated liprinα1, *P < 0.05 vs. P10, one-way ANOVA with the Student–Newman–Keuls test; n = 3 independent experiments. (C–F) Roscovitine (Ros) treatment increased liprinα1 localization density and percentage within the PSD-95 region. Neurons were treated with DMSO as control (Con) or Ros (25 µM) for 2 h and then stained with liprinα1 and PSD-95 after fixation. (C) Individual synapses showing the distribution of liprinα1 (green) surrounding PSD-95 (red) in the Con and Ros groups. (Scale bar: 200 nm.) (D) Representative images of the defined PSD-95 region (with yellow outline, area 1) and the surrounding region (red outline, area 2); both regions are indicated by dotted slashes. (Scale bar: 200 nm.) (E and F) Quantification of the localization points (NLPs) of liprinα1 per square micrometer of area 1, and the percentage of liprinα1 within area 1 vs. the total area (area 1 plus area 2). ***P < 0.001, Student’s t test; n = 53 and 51 synapses for Con and Ros, respectively. (G and H) Bicuculline (Bic) treatment (40 µM, 24 h) enriched liprinα1 and PSD-95 in the synaptosome, but did not affect their total levels. (G) Representative Western blot. (H) Quantification of protein level change of liprinα1 and PSD-95 in the synaptosome. *P < 0.05; **P < 0.01, Student’s t test; n = 5 independent experiments. (I and J) Bic treatment or overexpression of liprinα1 TA mutant alone increased PSD-95 puncta density. (I) Representative images of PSD-95 puncta distributed along the dendrites of neurons overexpressing WT or TA liprinα1 with or without Bic treatment. (Scale bar: 10 μm.) (J) Quantification of PSD-95 puncta density. *P < 0.05; **P < 0.01 vs. WT Con, one-way ANOVA with the Student–Newman–Keuls test; n = 9, 12, 8, and 9 neurons for WT Con, WT Bic, TA Con, and TA Bic conditions, respectively. All data are mean ± SEM.


