Fig. S4.
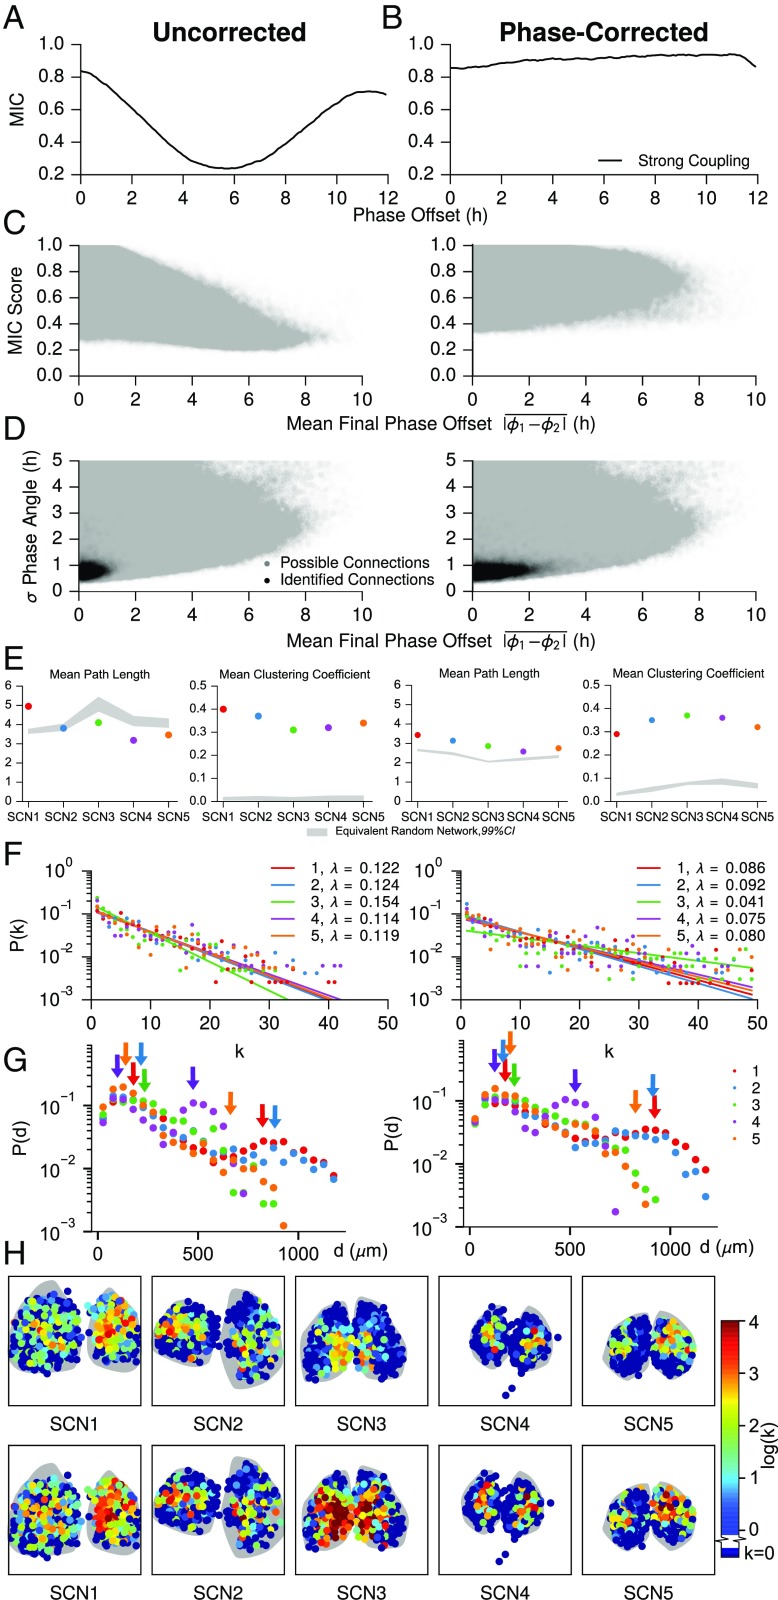
Effect of phase offset on MIC network inference. MIC is not phase-agnostic, and so the question arises of whether the inferred functional networks are driven by phase distributions in each SCN, similar to the phase clusters identified in (19). First, we show how phase offset affects MIC score for pairs of synchronized oscillators. Next, we show that realigning out of phase trajectories and taking the maximum MIC reduces much of this bias. Finally, we examine how this affects the connections we identify in the five SCN tissues, and show that our results are consistent after applying this phase offset correction. (A) The MIC score varies with phase offset between two phase-locked oscillators. Each point on this plot was generated by simulating 50 pairs of strongly coupled cells, as in S2. Connected cells in this model synchronize to a phase offset of 0 h because they are parameterized identically. One trajectory from each pair was phase-shifted in 0.1-h increments up to 12 h, to generate a range of phase offsets between the trajectories. The mean MIC score (y axis) of the 50 pairs was then computed for each artificially created phase offset (x axis). As the phase offset between coupled cells is increased, the MIC score is reduced from its maximum at a 0-h angle. This is considered the uncorrected case, where MIC is computed with no regard for the phase offset between trajectories. (B) Next, we took the phase-shifted trajectories from A and performed a correction to renormalize MIC, so that MIC score is not affected by the phase offset between cells that we originally added. The correction was performed by again shifting the trajectories 12 h in either direction, this time in intervals of 1.0 h to reflect experimental sampling rate, and calculating MIC scores at each of these shifts. We then selected the largest of the resulting values as the MIC score for the cell pair, as this maximum MIC corresponds to when phases are realigned. In comparison with the uncorrected method, the maximum MIC correction results in reduced sensitivity to the phase offset between cells, as the corrected MIC score (y axis) is nearly flat with respect to the phase offset of the pair (x axis). This method reduces power, however, as some of the initial resynchronization period must be truncated to realign phases, resulting in a slight bias toward larger phase offsets. Thus, the uncorrected method (biased toward small phase offset) and corrected maximum MIC method (slightly biased toward large phase offset) form bounds on connectivity. (C) Scatter plot of MIC score vs. mean phase offset for all possible connections within each SCN. There is a clear bias against absolute phase offsets greater than ∼2 h (Left), in a similar form as A. This bias is rectified by performing the maximum MIC correction (Right). Phase offset (used only for plotting purposes) was calculated by a Hilbert transform after removing the trend via discrete wavelet baseline detrending. As the phase offset was unstable early during resynchronization, it was calculated after it had stabilized, during days 6–7. (D) Plot of SD of phase offset vs. mean phase offset for possible and identified connections within all five SCNs. SD of phase offset was calculated throughout the resynchronization period, and can be thought of as a measure of phase offset instability between two cells. As expected, MIC detects connections between cells with a low SD in phase offset for both cases, with a wider range of mean phase offsets. Thresholds were raised for each of the five SCNs (to 0.980, 0.970, 0.999, 0.985, and 0.985, respectively) after phase correction, as all MIC scores are increased by this method. Generally, cell pairs with a larger phase offset also had a less stable phase offset, such that even after phase offset correction most connections were between cells with a difference in phase of less than 2 h. (E) Phase-corrected SCN networks maintained small-world characteristics, with a comparable mean path length and larger clustering coefficient than corresponding random networks. (F) Node degree distributions for each SCN remain exponential (P < 0.0001 for each SCN, likelihood-ratio test comparison with power law fits), although λ changes corresponding to the increased average node degree for SCNs in which phases were aligned. SCN 3 deviates slightly from the others here, due to the high number of connections which yield saturated (1.0) MIC scores after realignment. (G) Connection length distributions for unaligned and phase-aligned networks. Despite the higher average node degree for aligned networks, these distributions continued to display two peaks: one for local connections within a core, and a second corresponding to core-core connections. (H) Similarly, core-shell hierarchy was maintained after phase-alignment. Additionally, many shell neurons remain functionally unconnected, indicating a much slower resynchronization than neurons in SCN core regions. These neurons do synchronize; however, they are less tightly synchronized than cells which have identifiable connections.

