Fig. 5.
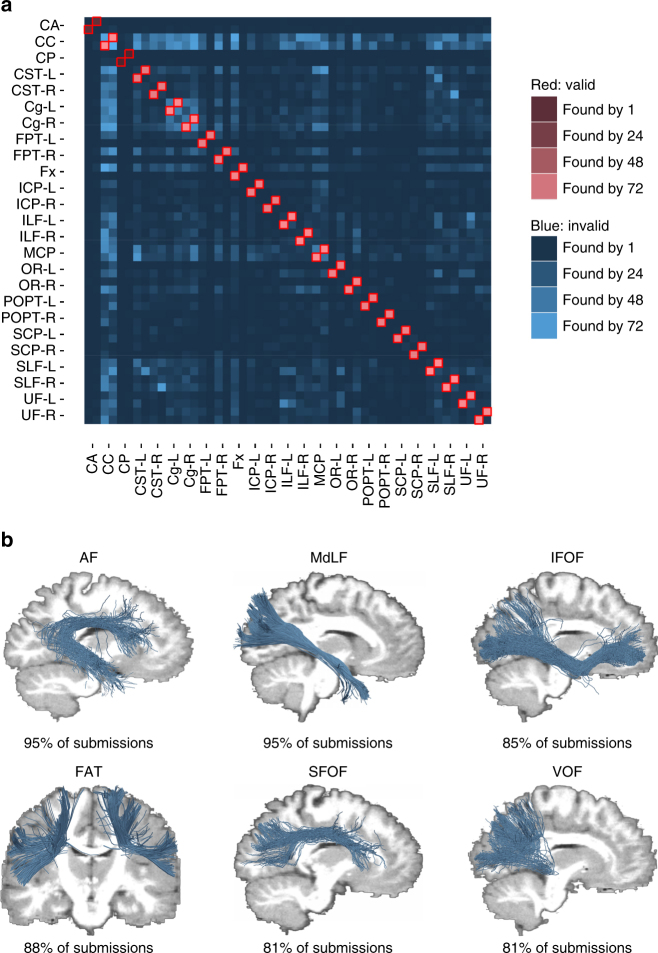
Overview of VBs and IBs and examples of invalid streamline clusters. a Each entry in the connectivity matrix indicates the number of submissions that have identified the respective bundle. The two rows and columns of each bundle represent the head-endpoint and tail-endpoint regions. The connectivity matrix indicates a high number of existing tracts that were identified by most submissions (red). It also indicates systematic artefactual reconstructions across teams (blue). b Examples of IBs that have been consistently identified by more than 80% of the submissions, but do not exist in the ground truth data set. The AF, for example, was generated from ILF and SLF crossing streamlines, whereas the IFOF was generated from by crossing ILF and UF streamlines. The MdLF, FAT, SFOF, and VOF were other examples of highly represented IBs

