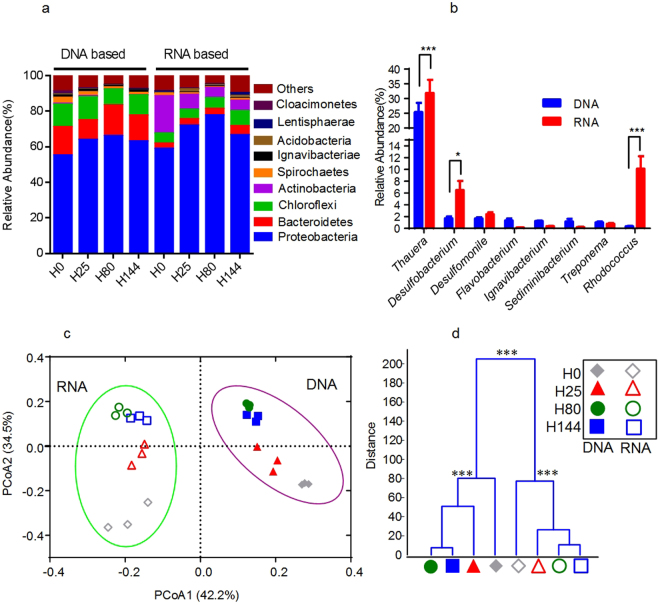
Figure 2.
Over all structural changes of microbiota community during quinoline-degrading process based 16S rRNA gene V1-V3 454 pyrosequencing. Comparison of relative abundances of the major phylotypes (relative abundances above 1%) found in the DNA and RNA data. (a) At phylum level (b) at genera level. (a) The left part represents the phylotypes from the DNA, and the right part represents the phylotypes from the RNA-based data. The colors correspond to the major phylogenetic groups of the phylotypes. The different parts of the stacked bars represent the phylotypes identified. (b) The different stars above the columns mean significant differences as assessed by Tukey’s test (*P < 0.05, ***P < 0.001). (c) Bray-curtis PCoA of the quinoline-degrading microbiota at time H0, H25, H80 and H144 based on pyrosequencing OTU (97% identity) data. The values in parenthesis indicate the percentage of community variation explained by the axes. (d) Clustering of microbiota based on mahalanobis distances between different groups calculated with multivariate analysis of variance test, ***P < 0.001.

