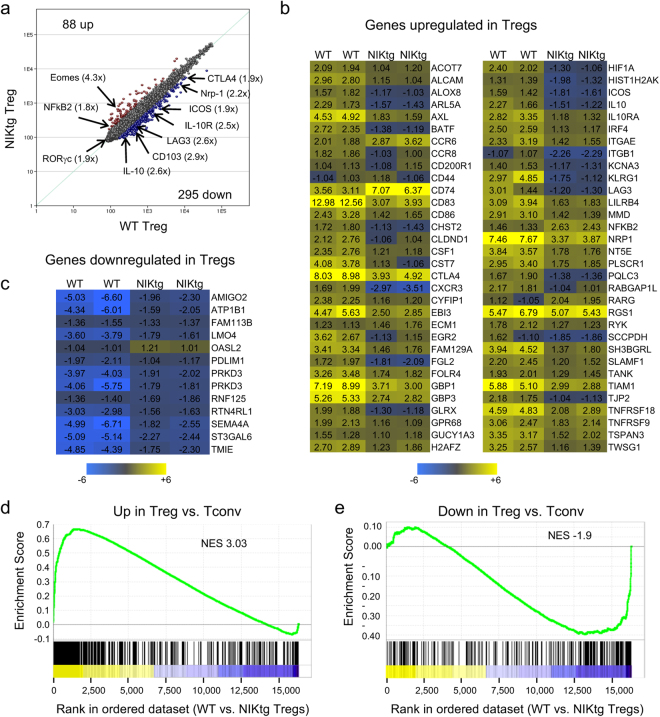
Figure 2.
Gene expression patterns in NIKtg Tregs. WT and NIKtg Tregs (CD4+CD25hi) were sorted from spleens of healthy mixed BM chimeric mice in which WT BM chimeric mice were reconstituted with equal numbers of CD4Cre/NIKtg and congenically marked WT bone marrow. Total RNA was isolated for microarray and miRNA analysis (Fig. 3). Data show averages of 2 biological replicates for each population except (b,c), which show both replicates. (a) Correlation of gene expression between WT and NIKtg Tregs. (b,c) Genes classically increased (b) or decreased (c) in Tregs (Immgen) that are differentially regulated between NIK-tg and WT Tregs. Numbers indicate fold change versus WT Tconv. (d,e) GSEA analysis using Immgen generated “upregulated in Tregs vs. Tconv” and “downregulated in Tregs vs. Tconv” gene sets. Genes are ranked along the x-axis by their fold change in WT Tregs vs. NIKtg Tregs with yellow indicating genes higher in WT Tregs and blue indicating genes lower in WT Tregs (higher in NIKtg Tregs). Enrichment scores are indicated on the y-axis; negative enrichment score (e) indicates that the gene set is enriched in those genes that are higher in NIKtg Tregs than WT Tregs. NES, normalized enrichment score. For both plots, the indicated gene set is significantly enriched at nominal p-value < 0.01 and nominal FDR < 0.25.

