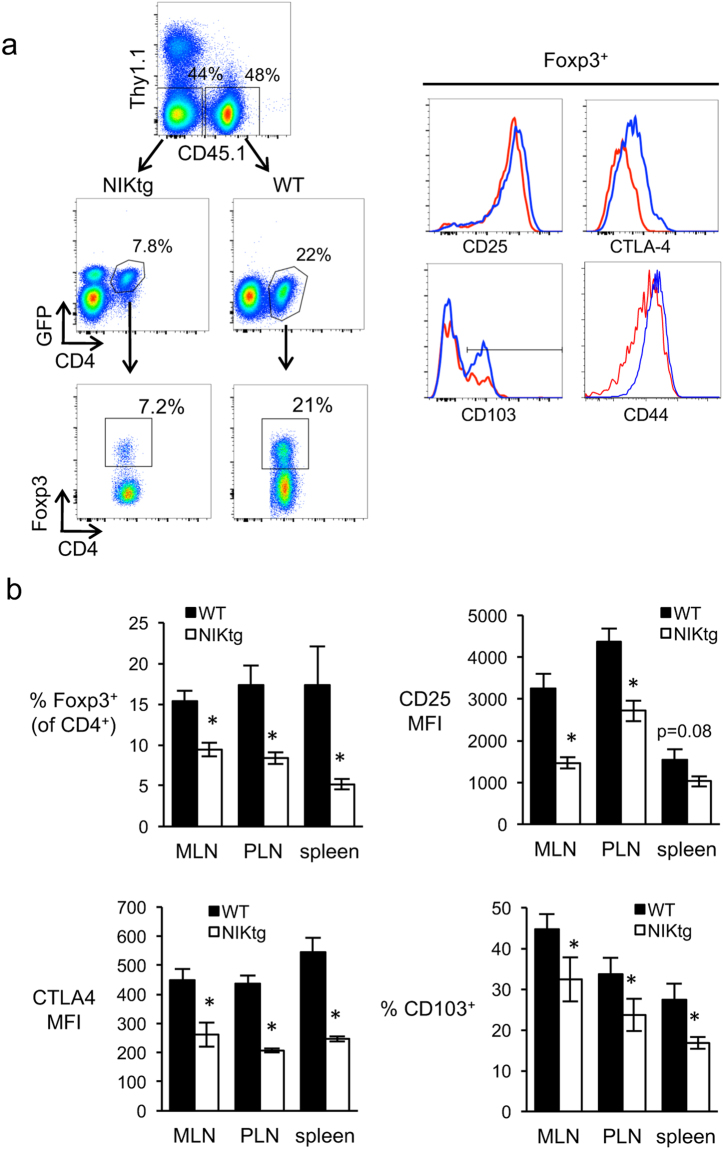
Figure 4.
NIKtg Treg proportions and phenotype in mixed BM chimeras. Mixed BM chimeric mice were generated as described in Fig. 2 except that mixed BM recipients were Thy1.1 and WT BM was CD45.1. (a) Gating strategy and representative histograms of surface molecule expression in splenocytes. Upper left dot plot is gated on live lymphocytes. Blue lines, WT; red lines, NIKtg. (b) Quantitation of Foxp3+ proportion within the indicated genotype of CD4 T cells (upper left graph) and expression of CD25, CTLA-4, and CD103 on Foxp3+ gated cells from the indicated organs. MFI, mean fluorescence intensity; MLN, mesenteric lymph nodes; PLN, peripheral lymph nodes. Data are from one representative experiment of 3. Bar graphs depict mean +/− SD (n = 5 mice). *p < 0.05.

