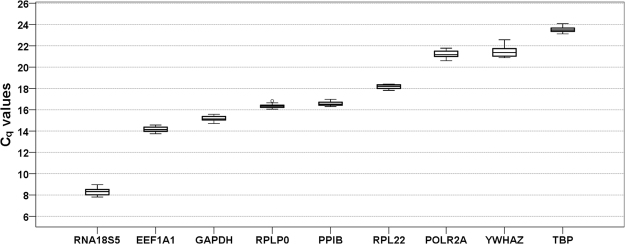
Figure 2.
Expression levels of candidate reference genes across all experimental groups (n = 18). Values are presented as quantification cycle (Cq, mean of triplicate technical replicates) as second derivative maximum of the fluorescence curve and are inversely proportional to the initial amount of cDNA. Genes are ordered from left (highest expression) to right (lowest expression) according to their mean Cq values. Gene names see Table 1. Boxplots show median, interquartile range (box) and data range (whiskers).

