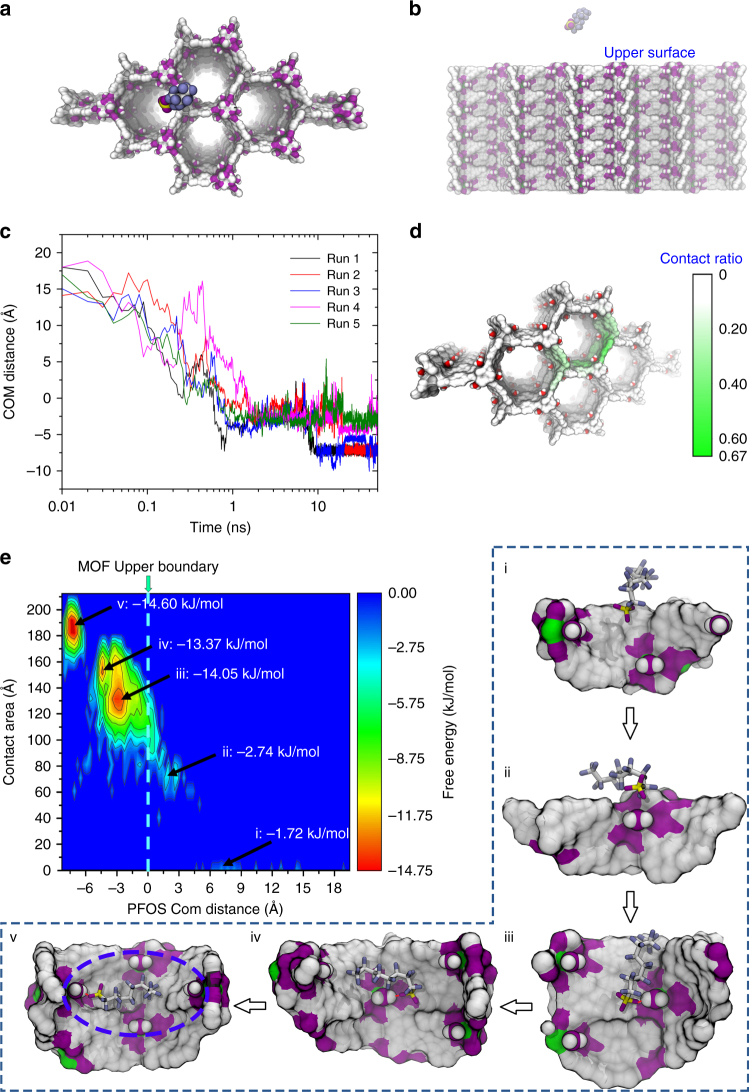
Fig. 5.
MD simulations on the binding pattern and adsorption pathway of PFOS into SCU-8. The top a and side b view of simulation system, for clarity only PFOS and SCU-8 are shown; c the distance between center of mass (COM) of PFOS and the upper surface of SCU-8 for all five independent runs; d the contact ratio between PFOS and SCU-8; e the PFOS binding free energy surface (in kJ/mol), which is estimated by W(A cont, D com) = −K b TlnP(A cont, D com), where P is probability of finding the PFOS at position (A cont, D com). The color bar for the free energy (in kJ mol−1) is given on the right panel figure. Snapshots i–v highlighted by the dashed box represent five specific PFOS-SCU-8 binding modes correspond to the five free energy basins

