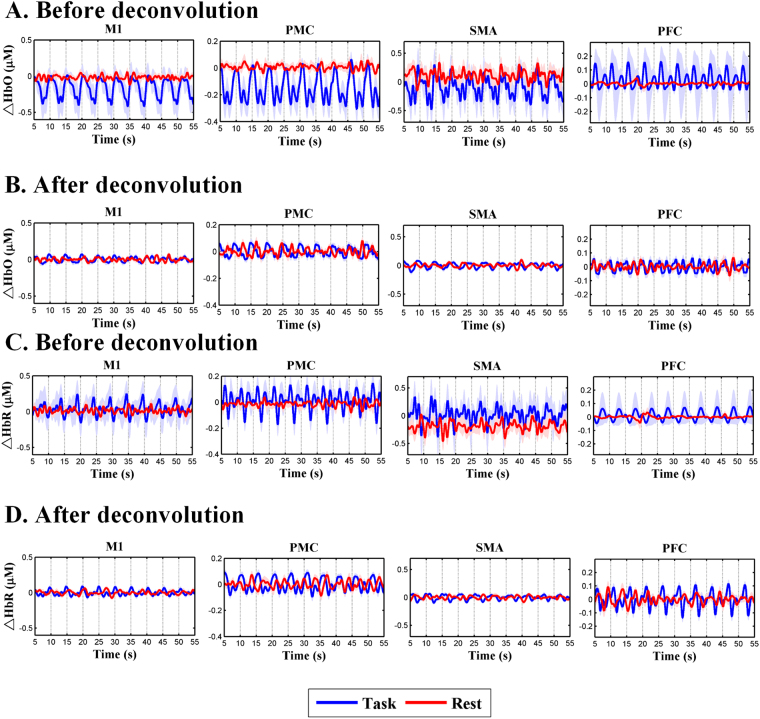
Figure 1.
The effect of neurovascular coupling. The task-based and resting-state concentration changes in HbO (∆HbO) over the four ROIs before (A) and after HRF deconvolution (B). The task-based and resting-state concentration changes in HbR (∆HbR) from the four ROIs before (C) and after HRF deconvolution (D). The blue curves represent ∆HbR/ during performance at task-based and the red curves denote ∆HbO/∆HbR at resting-state. The pale blue lines and pale red lines represented the standard error for the task-based and resting-state recordings, respectively. M1, primary motor cortex; PMC, premotor cortex; SMA, supplementary motor area; PFC, prefrontal cortex; ROI, region of interest.

