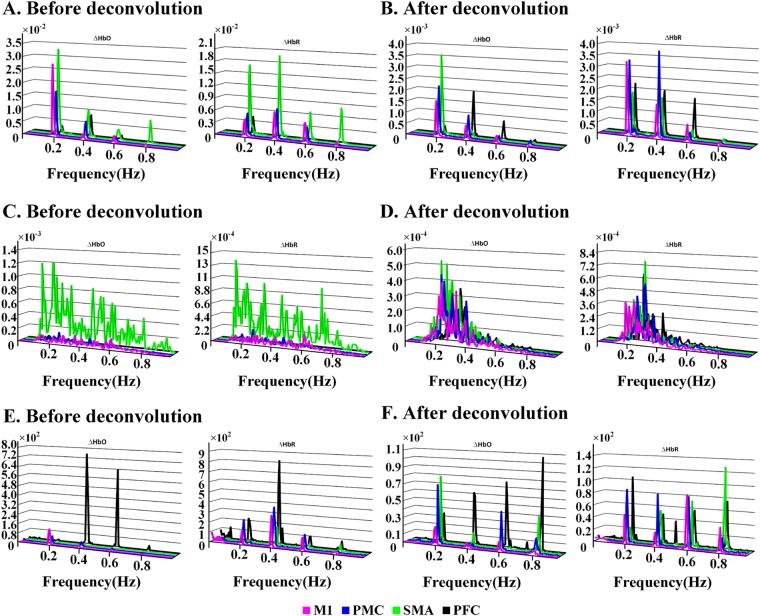
Figure 2.
The grand average of task-evoked lfSSBR (A,B), and resting-state lfSSBR (C,D) and the relative power of lfSSBR (task divided by rest) (E,F) at both the fundamental frequency of stimuli (0.2 Hz) as well as its harmonics (0.4, 0.6 and 0.8 Hz). At the fundamental frequency of stimuli (0.2 Hz), the task-related lfSSBR were significantly induced.) The power of task-evoked lfSSBR before and (A) after HRF deconvolution (B). The power of resting-state lfSSBR before (C) and after HRF deconvolution (D). The relative power of lfSSBR (task/rest) before HRF (E) and after HRF deconvolution (F). lfSSBR, low frequency steady-state brain response; ∆HbO, concentration changes in oxygenated hemoglobin; ∆HbR, concentration changes in de-oxygenated hemoglobin; M1, primary motor cortex; PMC, premotor cortex; SMA, supplementary motor cortex; PFC, prefrontal cortex.

