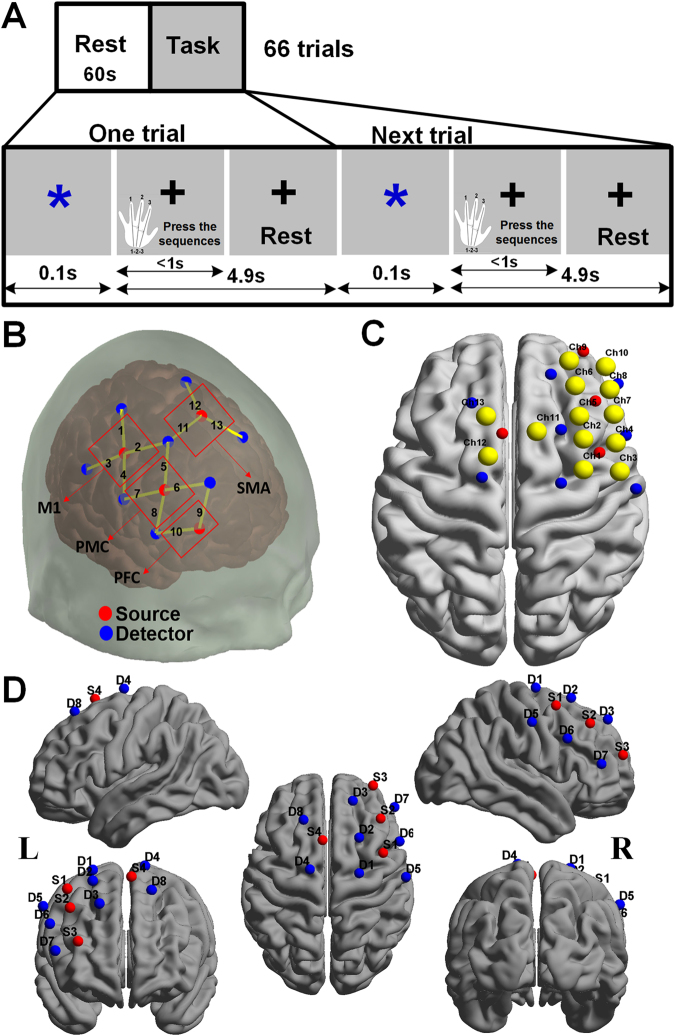
Figure 5.
The task design for fNIRS and probe arrangements and 3D channel locations for the subjects. (A) The session includes 66 trials. Each trial consists of a 0.1 s blue asterisk and a 4.9 s fixation. Subjects were required to press three fingers orderly as fast and accurately as possible when they saw the asterisk. The reaction time was determined by the interval between the onset of the presentation of the asterisk and the complete of the key-press response. (B) The red and blue solid circles indicate the positions of emitters and detectors, respectively. The red rectangles represent the ROIs defined in this study including the M1, the PMC, the SMA, and the PFC and the numbers stand for the emitter-detector pairs, i.e. channels. (C) Co-registered positions of channels on a standard brain atlas. The yellow circles denote the 13 channels. (D) Co-registered configurations of the optodes on a standard brain atlas. The brain image was visualized with the BrainNet Viewer (http://www.nitrc.org/projects/bnv). The anatomical position of each channel on the brain atlas is reported in detail in Table 4. M1, primary motor cortex; PMC, premotor cortex; SMA, supplementary motor area; PFC, prefrontal cortex; ROI, region-of-interest; L, left hemisphere; R, right hemisphere.

