Figure 5.
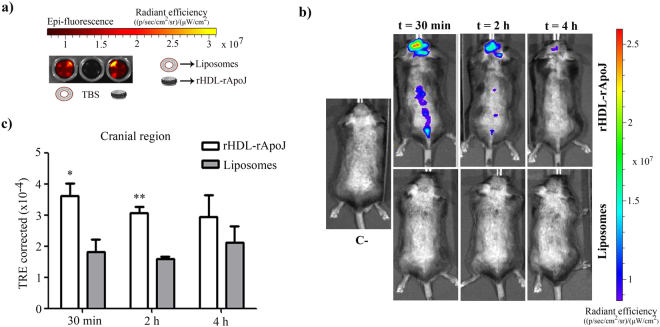
rHDL- rApoJ and liposome biodistribution in C57/BL6 mice. (a) IVIS Xenogen in vitro images of the epi-fluorescence of rHDL-rApoJ nanodisc and liposome preparations. (b) Representative in vivo IVIS Xenogen images of mice at 30 min, 2 h and 4 h after IV administration of labelled-rHDL-rApoJ or labelled-liposomes. C− = Non-treated control mouse. (c) Quantification of the fluorescent signal obtained in the cranial region after IV administration of labelled-rHDL-rApoJ nanodiscs or labelled-liposomes in 8 week-old C57/BL6 mice (N = 5–6/group). t-test analysis: *p < 0.05; **p < 0.01 signal from rHDL-rApoJ nanodiscs compared to liposome treatment at each time-point.

