Figure 6.
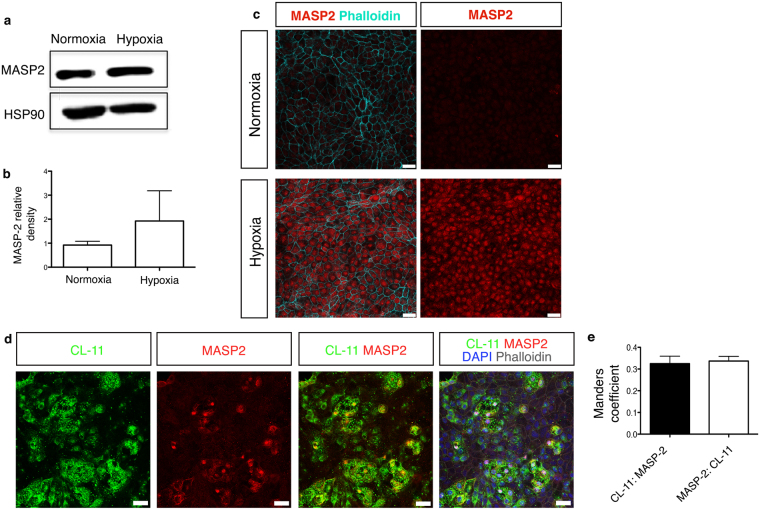
CL-11 and MASP-2 interaction on hypoxia-stressed iPS-RPE cells. (a) Representative Western blot showing MASP-2 protein expression in iPS-RPE cells under normal and hypoxic conditions. HSP90 was used as a loading control. Full-length blots are presented in Supplemental Fig. 6. (b) Relative density analysis of MASP-2 in iPS-RPE cells under different treatments. N = 3 independent experiments. (c) Representative immunofluorescence images showing MASP-2 staining on hypoxia-stressed iPS- RPE cells compared to non-stressed cells. MASP-2 (red) and phalloidin (aqua) are shown on the left panels and MASP-2 (red) alone is shown on the right panels. Scale bars, 25 μm. (d) Representative immunofluorescence images showing co-expression of CL-11 and MASP-2 (orange) on the surface of hypoxia-stressed iPS- RPE cells MASP-2 (red), CL-11 (green) nuclei (blue) and phalloidin (grey) are shown. Scale bars, 25 μm. (e) CL-11 and MASP-2 co-localization was quantified by calculating Mander’s co-localization coefficients using JACoP plug-in and ImageJ software.

