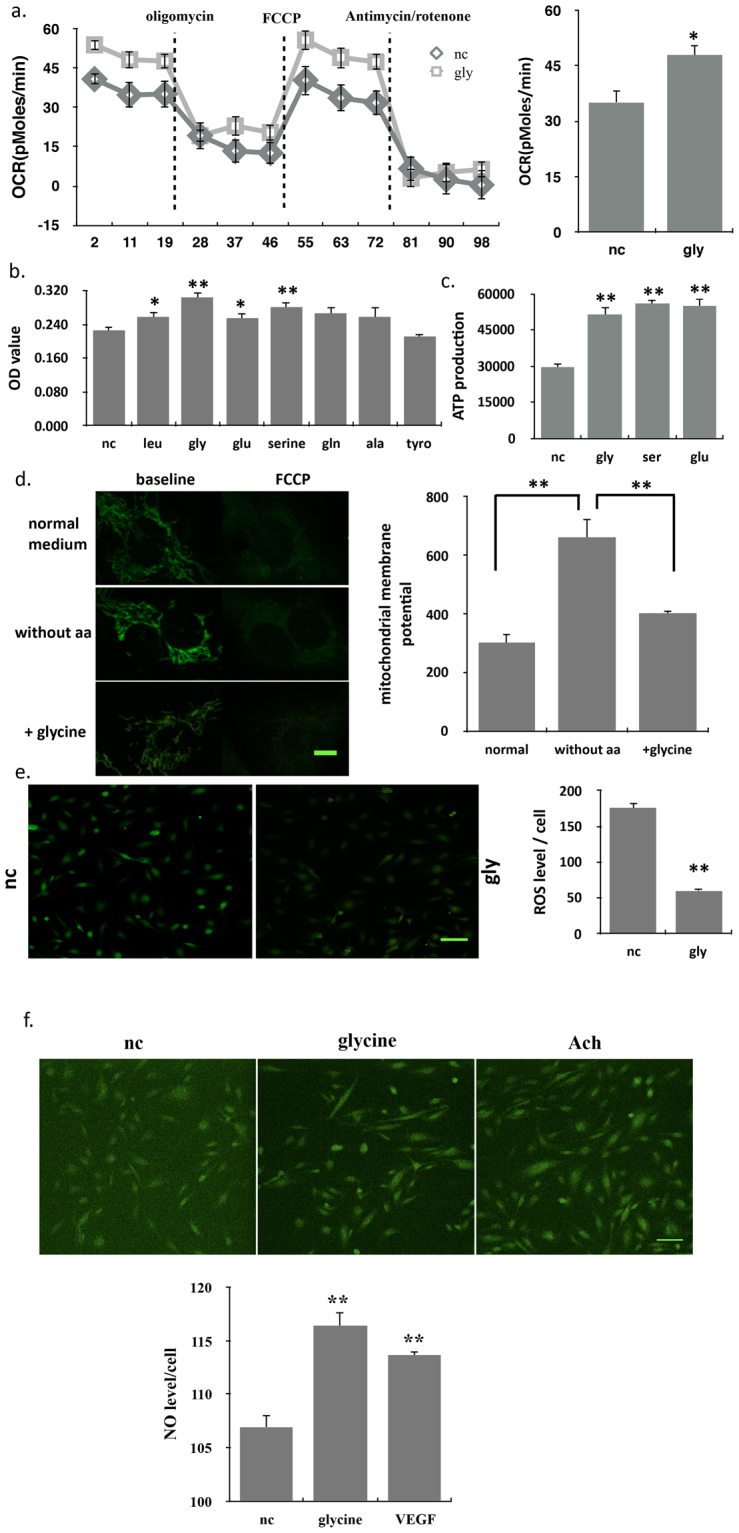
Figure 3.

Glycine obviously promoted the mitochondrial function. (a) FCCP coupled oxygen consumption rate (OCR) showing higher respiration in ECs treated with glycine than controls (n = 10). (b) Mitochondrial activity was tested by MTT in ECs treated with different amino acids (n = 12). (c) Intracellular ATP levels in control and glycine-treated ECs (n = 16). (d) Changes in mitochondrial membrane potential (ΔΨm) in ECs cultured in RPMI-1640 without amino acids medium or adding glycine. ΔΨm was indicated by Rh-123 fluorescence staining (λex = 460, λem = 520) and observed with a laser confocal microscope. Scale bar, 10 µm (n = 16). (e) Intracellular ROS levels in control and glycine-treated ECs as measured using DCFH-DA. ROS staining was observed with a laser confocal microscope. Left: representative images of ROS staining; right: ROS fluorescence intensity in per cell. Scale bar, 100 µm (n = 10). All values represented mean ± SEM of n independent experiments. **P < 0.01, *P < 0.05, 1-way ANOVA. (f) Intracellular NO levels in control, glycine or Ach-treated ECs as measured using DAF-FM DA. NO staining was observed with a laser confocal microscope. Upper: representative images of NO staining; Down: NO fluorescence intensity in per cell. Scale bar, 100 µm (n = 10). All values represented mean ± SEM of n independent experiments. **P < 0.01, *P < 0.05, 1-way ANOVA.
