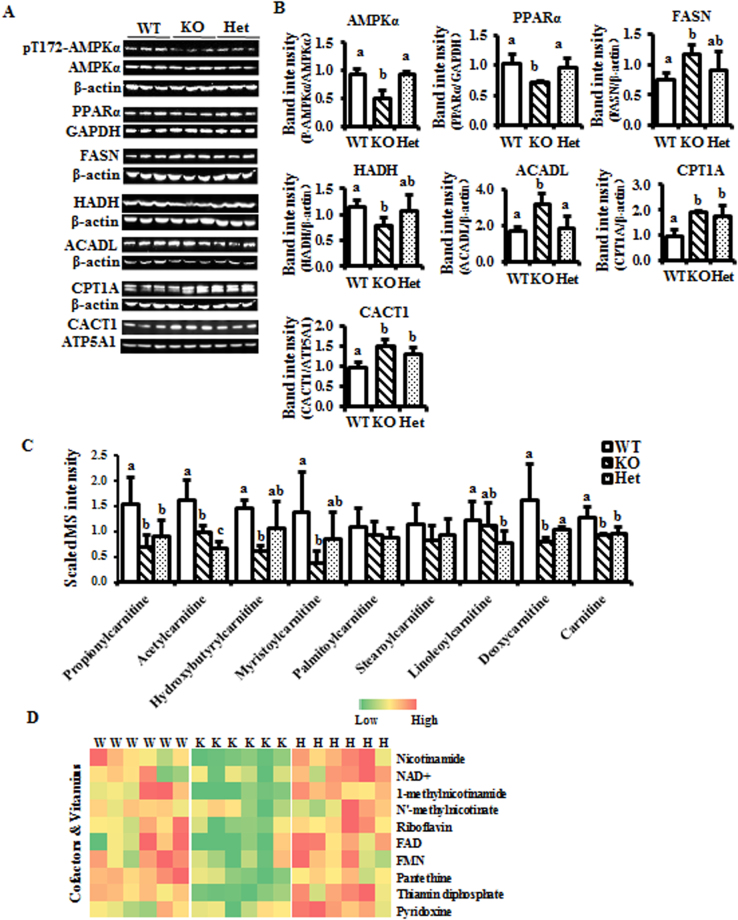
Figure 5.
Energy metabolism is perturbed in the BCO2 KO liver. (A) Expression of proteins associated with energy metabolism, particularly lipid metabolism by immunoblotting. (B) Quantifications of listed proteins. (C) Metabolites associated with lipid metabolism. (D) Heat map of cofactors and vitamins associated with energy metabolism. Heat map only presents the significantly changes metabolites. Values are means ± SD. Data was analyzed by one-way ANOVA. n = 6. Different letters indicate significant difference between groups. P-value ≤ 0.05 is considered as significant. AMPKα, AMP activated protein kinase α; PPARα, peroxisome proliferator activated receptor α; FASN, fatty acid sunthase; HADH, mitochondrial hydroxyacyl-coenzyme A dehydrogenase; ACADL, long-chain specific acyl-CoA dehydrogenase; CPT1A, carnitine palmitoyltransferase 1α; CACT1, carnitine/acylcarnitine translocase 1; GAPDH, glyceraldehyde 3-phosphate dehydrogenase; ATP5A1, ATP synthase, H+ transporting, mitochondrial F1 complex, alpha subunit 1; W and WT, wild type; H and Het, BCO2 heterozygous mice; K and KO, BCO2 knockout mice.

