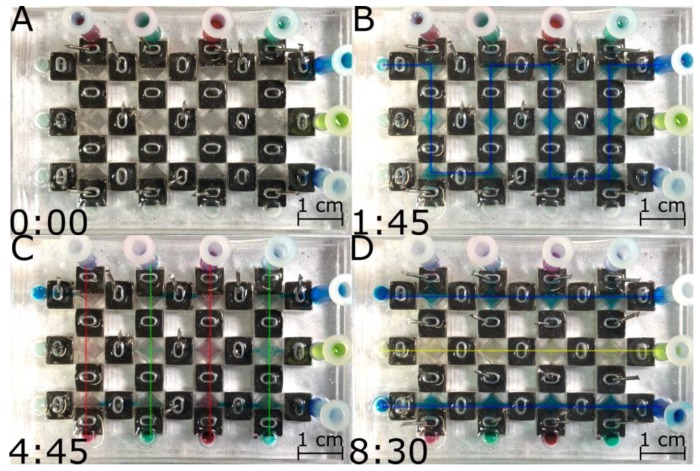
Figure 4.
Screen captures from a video (see Supplementary Video S1) illustrating a typical flow rerouting experiment inside a SCCA (A) Device before loading at t = 0 min; (B) Loading of the device with blue dye through one inlet (top right) and one outlet (top left) at t = 1.75 min; (C) Vertical loading (top to bottom) of the device with red and green dyes at t= 4.75 min; (D) Horizontal loading (right to left) of the device with blue and yellow dyes at t = 8.5 min. The arrows indicate the direction of the flow in the channel and the color of the aqueous solution used.

