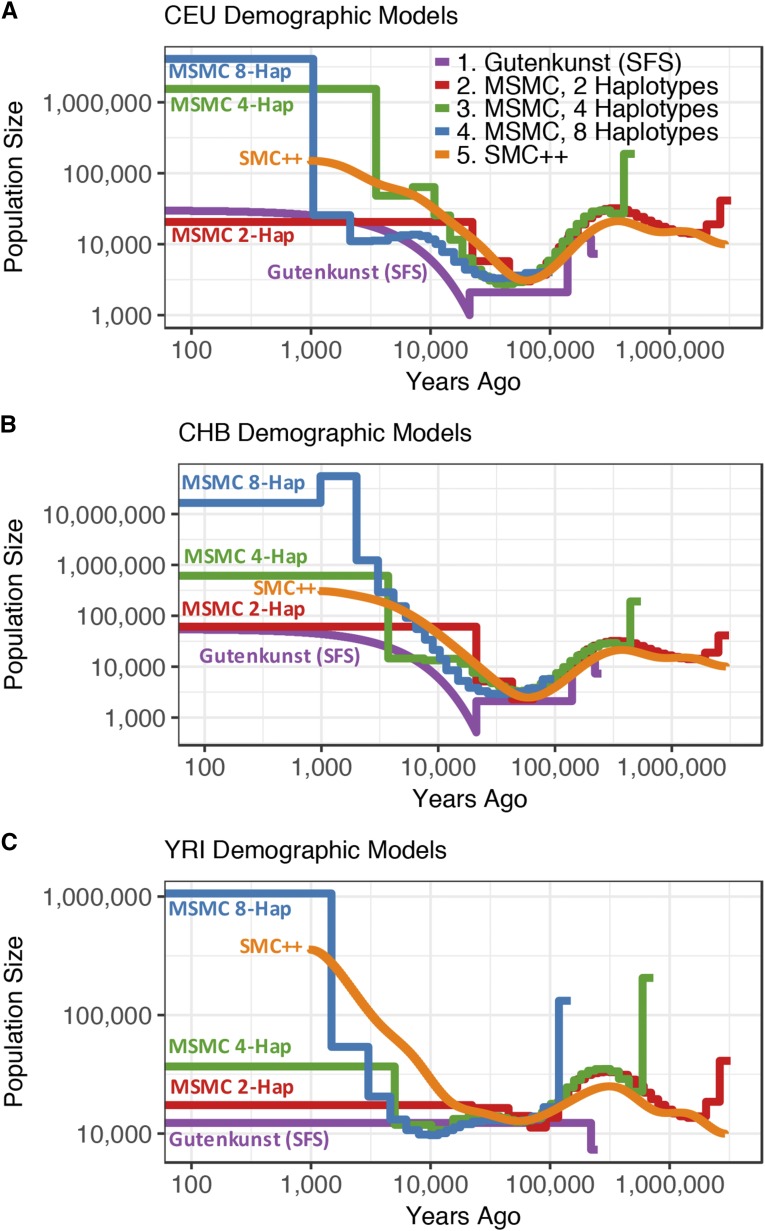
Figure 1.
Demographic histories for the (A) CEU, (B) CHB, and (C) YRI populations. Trajectories are log scaled and in terms of physical units (diploid individuals and years). Models were either inferred using SFS-based methods (Gutenkunst) by Gutenkunst et al. (2009); from a sequentially Markovian coalescent-based approach (MSMC) from two, four, and eight haplotypes by Schiffels and Durbin (2014); or using a combined SFS and whole genome approach (SMC++) by Terhorst et al. (2017). The Gutenkunst models also include migration between all three populations, not depicted here. Models are scaled by the generation times used in each study [Gutenkunst et al. (2009): 25 yr/generation; Schiffels and Durbin (2014): 30 yr/generation; Terhorst et al. (2017): 29 yr/generation].

