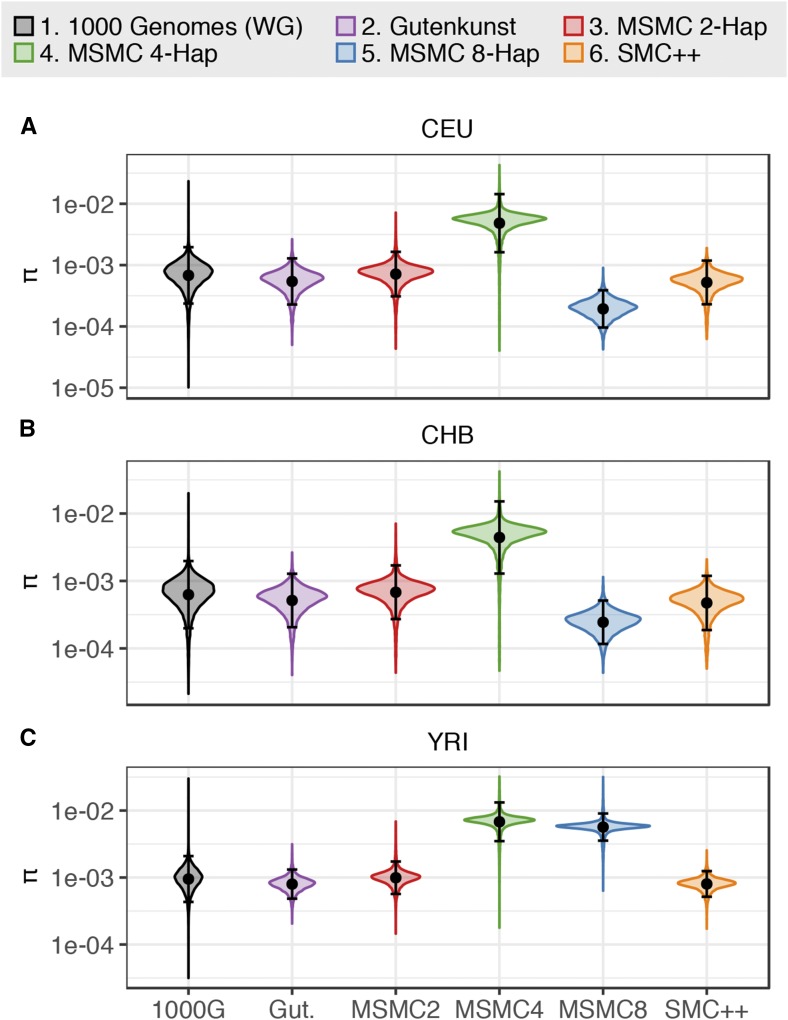
Figure 2.
Kernel density distribution of expected heterozygosity (π per site). Heterozygosity was calculated across 100-kb windows from whole genome 1000 Genomes Project data for (A) CEU, (B) CHB, and (C) YRI, and from 20,000 × 100-kb blocks for data simulated under each demographic model. The black dot and bars indicate the mean ± 2 SD for each distribution. Note the log-10 scaling on the y-axis.

