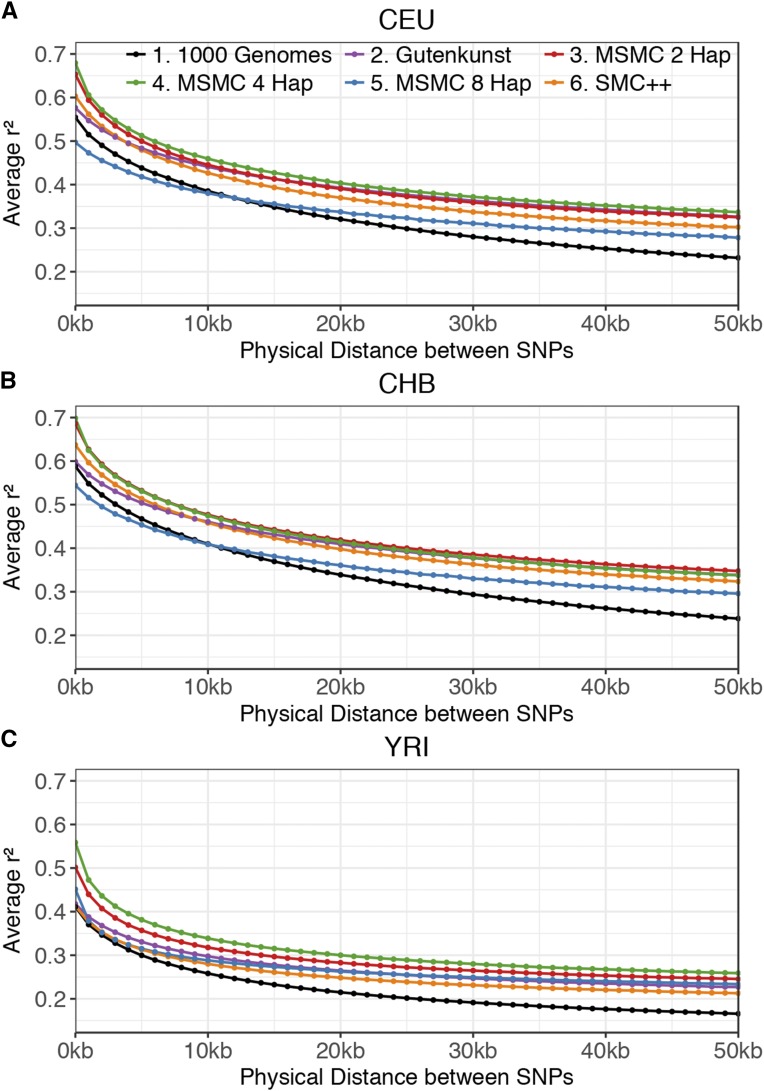
Figure 3.
LD decay patterns. LD decay was calculated across 100-kb windows from 1000 Genomes data and simulated data under each demographic model for (A) CEU, (B) CHB, and (C) YRI. Pairs of SNPs are binned based on physical distance (bp) between them, up to 51 kb. Average genotype r2 is calculated within each distance bin.

