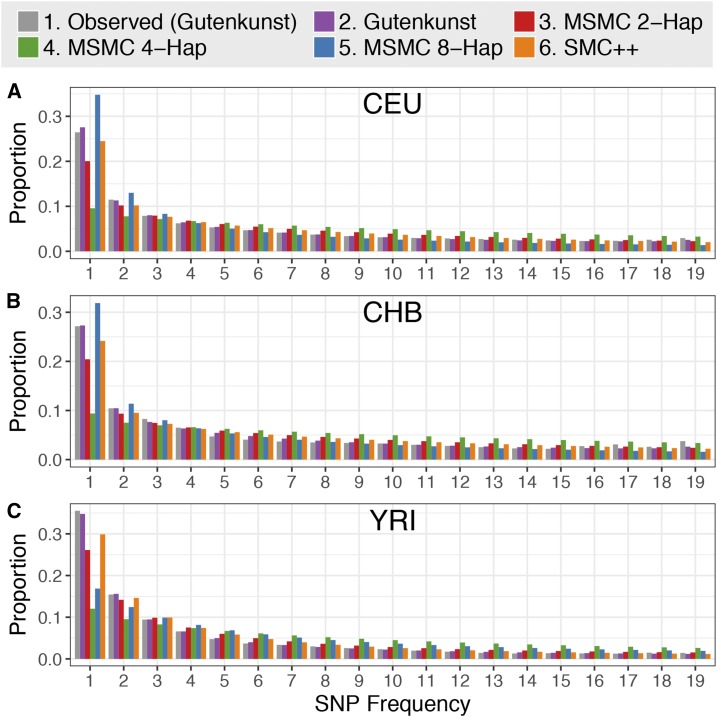
Figure 4.
Unfolded proportional site frequency spectra for (A) CEU, (B) CHB (B), and (C) YRI populations. The “observed” SFS is from noncoding sequence used by Gutenkunst et al. (2009) to infer demographic histories for these three populations. See Figure S5 in File S1 for scaling using alternative mutation rates.

