Figure 7.
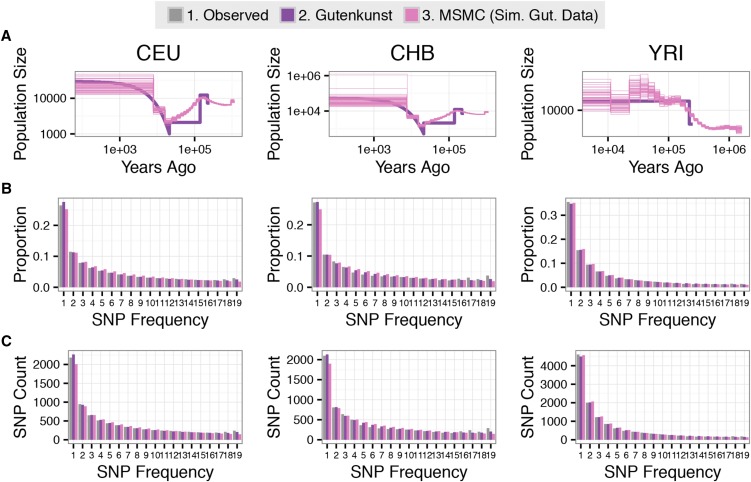
MSMC 2-haplotype can accurately infer the demographic model predicted by Gutenkunst et al. (2009). (A) The results of running MSMC 2-haplotype on 50 independent two-haplotype data sets simulated under the Gutenkunst et al. (2009) model of human demographic history (Gutenkunst, heavy purple line). The resulting MSMC 2-haplotype trajectories (“MSMC Sim. Gut. Data,” fine pink lines) show the MSMC trajectories inferred from these 50 data sets. Note that these trajectories accurately track the demographic model used to simulate the data. (B) and (C) show proportional and SNP count SFSs for each population, respectively. The gray bars (observed) denote the empirical SFS used by Gutenkunst et al. (2009). The purple bars denote the expected SFS under the inferred Gutenkunst demographic models. The pink bars denote the expected SFS under the average of the 50 MSMC 2-haplotype demographic model trajectories for each population. Note that these three SFSs agree.

