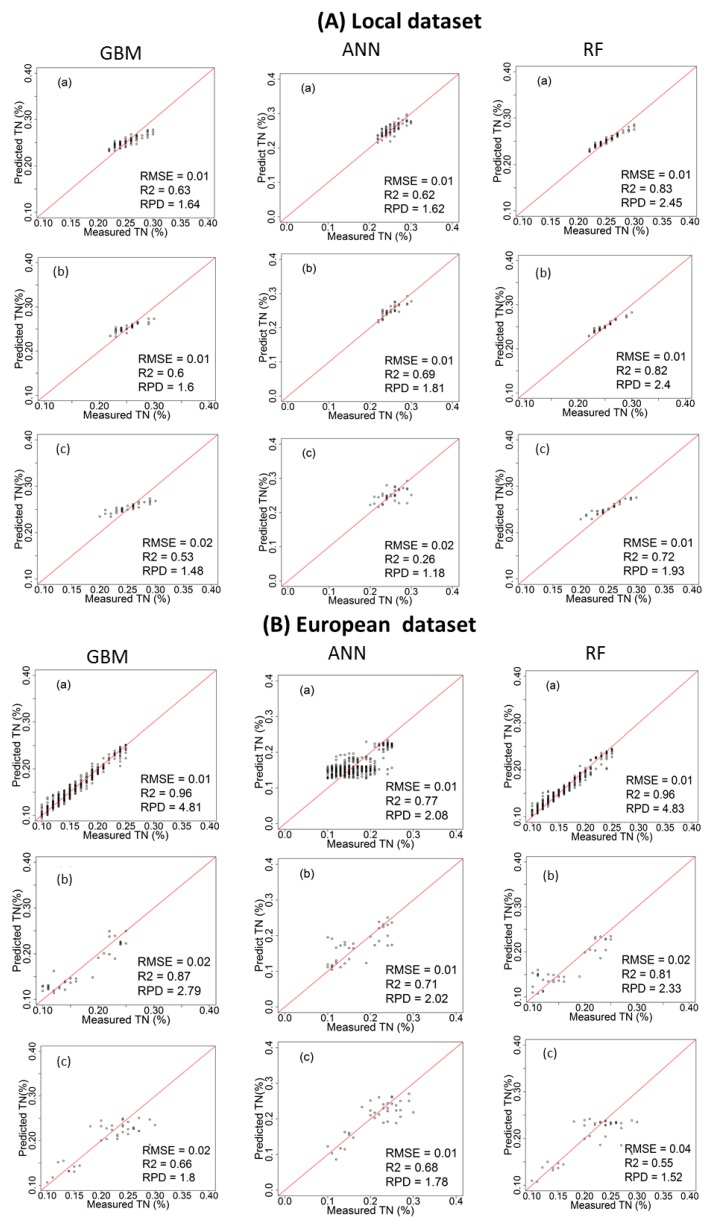
Figure 4.
Scatter plots of visible and near infrared (vis-NIR)-predicted versus laboratory-analysed total nitrogen (TN) in Hessleskew field in cross validation (a); lab prediction (b) and on-line prediction (c); using local dataset (A) and spiked European dataset (B); comparing between gradient boosted machines (GBM), artificial neural network (ANNs) and random forests (RF) models.

