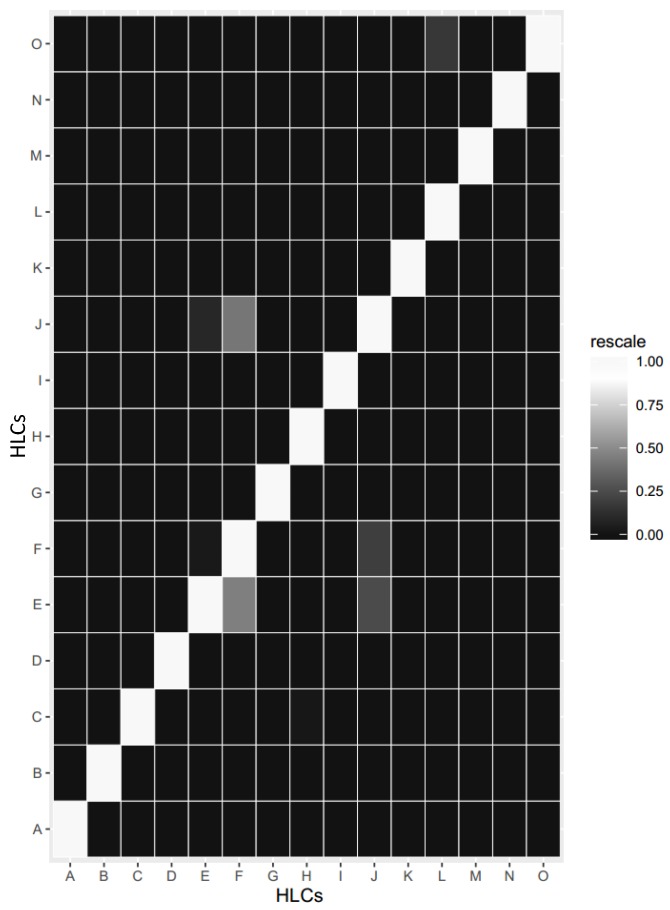
Figure 13.
Confusion Matrix expressed as heat map for recognized HLCs (PA-HLC, N-HLC, and C-HLC). Legend: A = Amusement, B = Commuting, C = Exercising, D = Gardening, E = Carbohydrate, F = Fats, G = Housework, H = Inactivity, I = OfficeWork, J = Protein, K = Sleeping, L = HighRiskHealthState, M = ModerateRiskHealthState, N = NormalHealthState, O = VeryHighRiskHealthState.

