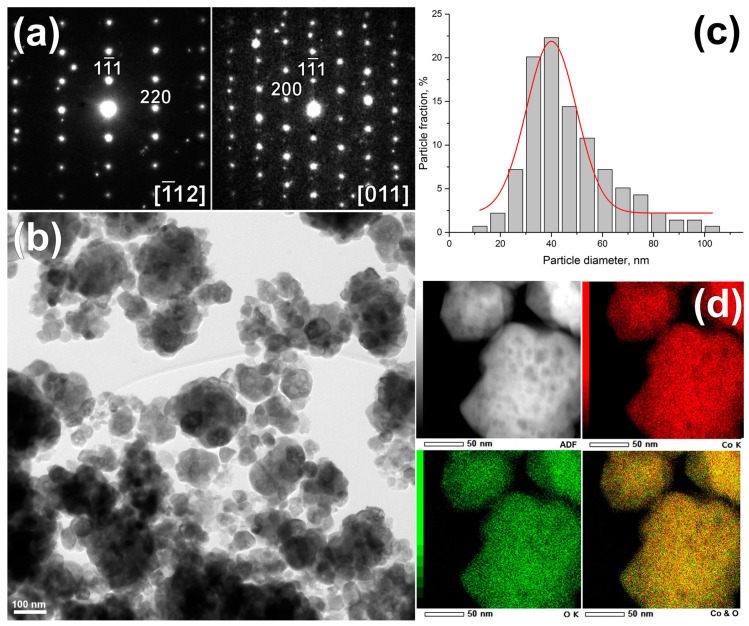
Figure 2.
Characterization of Co3O4 nanoparticles by TEM: (a) typical ED patterns of the Co3O4 along main crystallographic zone axes and [011]; (b) bright field low magnification TEM image; (c) particle size distribution calculated from TEM images; (d) energy-dispersive X-ray spectroscopy (EDX) elemental maps of Co (red), O (green) and their mixture.

