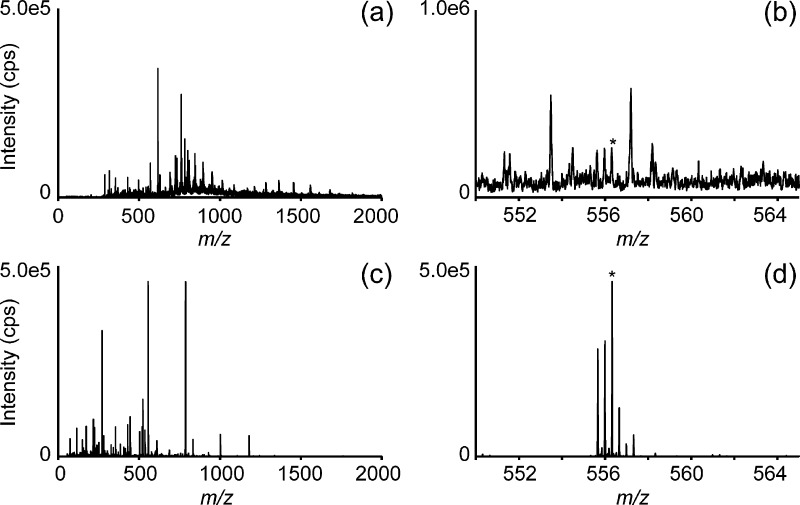
Figure 3.
Sensitivity of LESA-MS versus HR-LESA-μLC-MS: The total mass spectrum (a and c) and a zoomed-in mass spectrum (b and d) of the adenohypophysis region of rat pituitary gland using LESA-MS (a and b) compared to HR-LESA-μLC-MS (c and d). The zoomed mass range displays a low-intensity peak corresponding to the protonated molecule of leucine enkephalin (marked with *), which is known to be present in this region. This is extracted from the ion chromatogram at a retention time at 16 min. The zoomed mass range from HR-LESA-μLC-MS shows the presence of leucine enkephalin coeluting with a triply charged species, which was not observed with LESA-MS.

