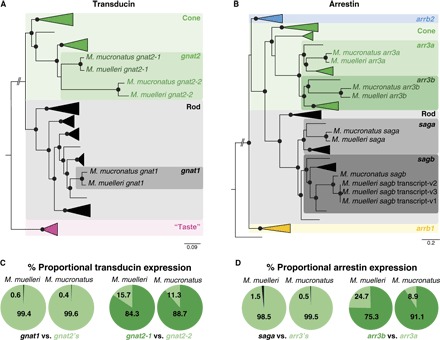
Fig. 2. Vertebrate phylogenies of phototransduction cascade genes and phototransduction cascade gene expression.

(A and B) Vertebrate Gα transducin (A) and vertebrate arrestin (B) gene phylogenies. Black spheres indicate Bayesian posterior probabilities >0.8. Detailed phylogenies and GenBank accession numbers are shown in figs. S3 and S4. Pearlside-specific accession numbers are given in table S4. gnat2, G protein subunit α transducin 2; gnat1, G protein subunit α transducin 1; “taste,” G protein subunit α transducin 3; arrb2, arrestin β2; arr3, arrestin 3; sag, s-antigen arrestin [saga is present in the outer segment, and sagb is present in the synapses (16)]; arrb1, arrestin β1. (C and D) The per-species mean of the proportional transducin (C) and arrestin (D) gene expression shows the almost exclusive use of cone transducin (gnat2) and cone arrestin (arr3) in pearlside vision.
